Algebra I Practice Cc.a.ced.2 Graphing Linear Functions 2 Worksheet
ADVERTISEMENT
 1
1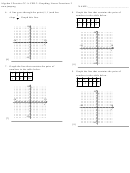 2
2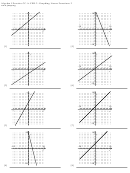 3
3 4
4Algebra I Practice CC.A.CED.2: Graphing Linear Functions 2
NAME:_____________________________
3. Draw the graph of a line with y-intercept 4
CCSS.A.CED.2: Create equations in two or more
7
variables to represent relationships between
and slope of
.
quantities; graph equations on coordinate axes with
4
labels and scales.
1. Draw the graph of a line with y-intercept 5
y
5
and slope of
.
6
y
x
[3]
x
4. A line goes through the point (2, 2) and has
slope 4 . Graph this line.
[1]
10
y
2. Draw the graph of a line with y-intercept –3
2
and slope of
.
3
–10
10
x
y
–10
[4]
x
5. A line goes through the point (3, 5) and has
5
slope
. Graph this line.
2
[2]
10
y
–10
10
x
–10
[5]
ADVERTISEMENT
0 votes
Related Articles
Related forms


 Worksheet Template With Answer Key")
 Worksheet Template With Answer Key")
 Worksheet Template With Answer Key")
 Worksheet Template With Answer Key")
 Worksheet Template With Answer Key")
 Worksheet Template With Answer Key")
Related Categories
Parent category: Education