Mathematics B Regents High School Examination - The University Of The State Of New York, 2003 Page 14
ADVERTISEMENT
 1
1 2
2 3
3 4
4 5
5 6
6 7
7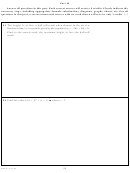 8
8 9
9 10
10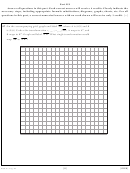 11
11 12
12 13
13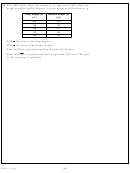 14
14 15
15 16
16 17
17 18
18 19
19 20
20 21
21 22
22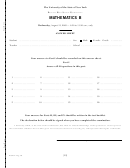 23
23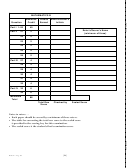 24
2431 The table below shows the results of an experiment that relates the
height at which a ball is dropped, x, to the height of its first bounce, y.
Drop Height (x)
Bounce Height (y)
(cm)
(cm)
100
26
90
23
80
21
70
18
60
16
Find x, the mean of the drop heights.
Find y, the mean of the bounce heights.
Find the linear regression equation that best fits the data.
Show that (x,y) is a point on the line of regression. [The use of the grid
on the next page is optional.]
[14]
Math. B – Aug. ’03
ADVERTISEMENT
0 votes
Related Articles
Related forms
 Mathematics B Regents High School Examination Worksheet- University Of The State Of New York, 2007
Education
Mathematics B Regents High School Examination Worksheet- University Of The State Of New York, 2007
Education
 Mathematics B Regents High School Examination - The University Of The State Of New York, 2007
Education
Mathematics B Regents High School Examination - The University Of The State Of New York, 2007
Education
 Mathematics B Regents High School Examination - The University Of The State Of New York, 2006
Education
Mathematics B Regents High School Examination - The University Of The State Of New York, 2006
Education
 Mathematics B Regents High School Examination - The University Of The State Of New York, 2006
Education
Mathematics B Regents High School Examination - The University Of The State Of New York, 2006
Education
 Mathematics B - Regents High School Examination - The University Of The State Of New York - 2009
Education
Mathematics B - Regents High School Examination - The University Of The State Of New York - 2009
Education

 Mathematics B Regents High School Examination Worksheet - The University Of The State Of New York, 2004
Education
Mathematics B Regents High School Examination Worksheet - The University Of The State Of New York, 2004
Education
 Mathematics B Test - Regents High School Examination, The University Of The State Of New York
Education
Mathematics B Test - Regents High School Examination, The University Of The State Of New York
Education


Related Categories
Parent category: Education