Mathematics B Regents High School Examination - The University Of The State Of New York, 2003 Page 3
ADVERTISEMENT
 1
1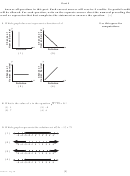 2
2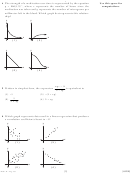 3
3 4
4 5
5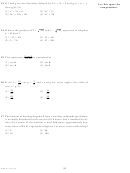 6
6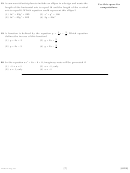 7
7 8
8 9
9 10
10 11
11 12
12 13
13 14
14 15
15 16
16 17
17 18
18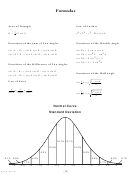 19
19 20
20 21
21 22
22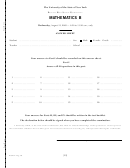 23
23 24
244 The strength of a medication over time is represented by the equation
Use this space for
–x
y = 200(1.5)
, where x represents the number of hours since the
computations.
medication was taken and y represents the number of micrograms per
millimeter left in the blood. Which graph best represents this relation-
ship?
y
y
x
x
( 1 )
( 3 )
y
y
x
x
( 2 )
( 4 )
x y
2 2
–
9
5 Written in simplest form, the expression
is equivalent to
3
–
xy
(1) –1
(3) –(3 + x y)
1
(2)
(4) 3 + x y
3 + xy
6 Which graph represents data used in a linear regression that produces
a correlation coefficient closest to –1?
y
y
x
x
( 1 )
( 3 )
y
y
x
x
( 2 )
( 4 )
[3]
[OVER]
Math. B – Aug. ’03
ADVERTISEMENT
0 votes
Related Articles
Related forms
 Mathematics B Regents High School Examination Worksheet- University Of The State Of New York, 2007
Education
Mathematics B Regents High School Examination Worksheet- University Of The State Of New York, 2007
Education
 Mathematics B Regents High School Examination - The University Of The State Of New York, 2007
Education
Mathematics B Regents High School Examination - The University Of The State Of New York, 2007
Education
 Mathematics B Regents High School Examination - The University Of The State Of New York, 2006
Education
Mathematics B Regents High School Examination - The University Of The State Of New York, 2006
Education
 Mathematics B Regents High School Examination - The University Of The State Of New York, 2006
Education
Mathematics B Regents High School Examination - The University Of The State Of New York, 2006
Education
 Mathematics B - Regents High School Examination - The University Of The State Of New York - 2009
Education
Mathematics B - Regents High School Examination - The University Of The State Of New York - 2009
Education

 Mathematics B Regents High School Examination Worksheet - The University Of The State Of New York, 2004
Education
Mathematics B Regents High School Examination Worksheet - The University Of The State Of New York, 2004
Education
 Mathematics B Test - Regents High School Examination, The University Of The State Of New York
Education
Mathematics B Test - Regents High School Examination, The University Of The State Of New York
Education


Related Categories
Parent category: Education