Parcc Algebra Ii Practice Test With Answers '- 2014 Page 13
ADVERTISEMENT
 1
1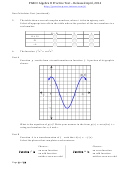 2
2 3
3 4
4 5
5 6
6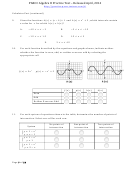 7
7 8
8 9
9 10
10 11
11 12
12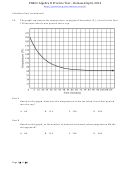 13
13 14
14 15
15 16
16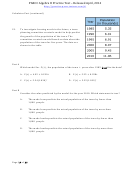 17
17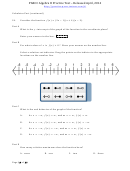 18
18 19
19 20
20 21
21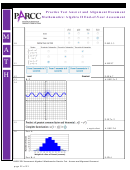 22
22 23
23PARCC Algebra II Practice Test – Released April, 2014
Calculator Part (continued)
The graph represents the temperature, in degrees Fahrenheit ( ) , of tea for the first
18.
120 minutes after it was poured into a cup.
Part A
Based on the graph, what was the temperature of the tea when it was first poured
into the cup?
A.
B.
C.
D.
Part B
Based on the graph, as the number of minutes increased, what temperature did the
tea approach?
A.
B.
C.
D.
Page 13 of 23
ADVERTISEMENT
0 votes
Related Articles
Related forms


Related Categories
Parent category: Education