Public Transport Worksheet Page 13
ADVERTISEMENT
 1
1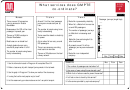 2
2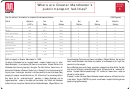 3
3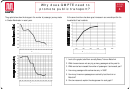 4
4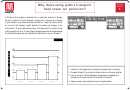 5
5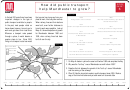 6
6 7
7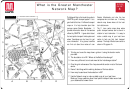 8
8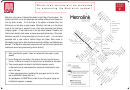 9
9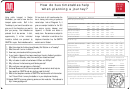 10
10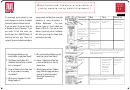 11
11 12
12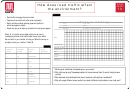 13
13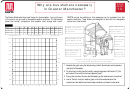 14
14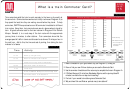 15
15 16
16 17
17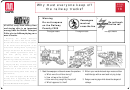 18
18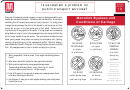 19
19 20
20W O R K
How does road traffic affect
S H E E T
the environment?
13
Chart A
• Road traffic damages the environment
• People and animals find traffic noise unpleasant
T R A F F I C
S U R V E Y
• Motor vehicles produce exhaust gases and pollution
Date
Time from
to
which damages our health
Street
Town
• Roads and car parks take up valuable land and green spaces
Recorder
Direction of traffic movement
1 2
3 4 5 6 7 8 9 10 11 12 13 14 15 16 17 18 19 20 21 22 23 24 25
Chart A. is a traffic survey sheet which you can use to
investigate just how much traffic there is near your school.
C A R S
Ask an adult or your teacher to help you. When the survey is
complete, enter your results in Table B.
M OTO R C YC L E S
Table B
COACHES (Pr i v a t e )
BUSES (Service)
Number of
Kilometres
Vehicle
Survey
people
per litre
type
Score Total
VA N S
LO R R I E S
2
20
Motorcycle
C YC L E S
M E T R O L I N K
5
10
Car
2
5
Van
1. Which type of vehicle had the highest score in your survey?
1
2
Lorry
2. Why is the bus carrying 75 passengers better for the environment than 15 cars all doing the same
journey?
Double-
75
1
decker bus
3. Why does most road vehicle pollution occur at junctions, traffic lights or roundabouts?
4. Why will you get different survey results if you stand at different road junctions in your local area?
200
1
Metrolink
ADVERTISEMENT
0 votes
Related Articles
Related forms

 Public Transportation Benefit Program Application - United States Air Force Outside The National Capital Region
Business
Public Transportation Benefit Program Application - United States Air Force Outside The National Capital Region
Business
 Form Com/att-010-2 - Order For Additional Vehicle Identification Cards By Holder Of A Public Transportation; Public Storage & Transportation; Or Individual Transportation Permit
Financial
Form Com/att-010-2 - Order For Additional Vehicle Identification Cards By Holder Of A Public Transportation; Public Storage & Transportation; Or Individual Transportation Permit
Financial

 Form St-135 - Sales And Use Tax Exemption Certificate For Purchases By Persons Engaged In Public Transportation
Financial
Form St-135 - Sales And Use Tax Exemption Certificate For Purchases By Persons Engaged In Public Transportation
Financial

 Public Safety Organization Independent Promoter Public Safety Publication Registration Statement - Texas Secretary Of State
Legal
Public Safety Organization Independent Promoter Public Safety Publication Registration Statement - Texas Secretary Of State
Legal
 Limited Public Bank (hong Kong) Limited Limited Personal Loan Application Form")


Related Categories
Parent category: Education