Analyzing Plots Worksheet - 5th Grade, Michael A. Maffesoli Page 2
ADVERTISEMENT
 1
1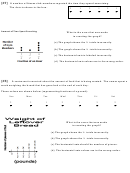 2
2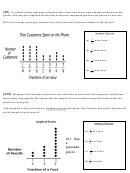 3
3 4
4 5
5[#7]
A number of fitness club members reported the time they spend exercising.
The data is shown in the box.
3
1
3
1
3
1
4
2
4
4
4
4
Amount of Time Spent Exercising
What is the error that was made
in creating the graph?
(a) The graph shows the ¾ totals incorrectly.
(b) The graph shows the ½ totals incorrectly.
(c) The horizontal axis is labeled incorrectly.
(d) The horizontal axis values are in the wrong order.
[#8]
A restaurant is worried about the amount of food that is being wasted. The owner spent a
week weighing the bread that has gone bad at the end of each day.
These values are shown below (representing fractions of a pound):
Sun
Mon
Tue
Wed
Thur
Fri
Sat
2
3
1
2
1
3
2
3
4
2
3
3
4
3
What is the error that was made
in creating the graph?
(a) The graph shows the ½ totals incorrectly.
(b) The graph shows the ¼ totals incorrectly.
(c) The horizontal axis should be number of pieces.
(d) The horizontal axis values are in the wrong order.
ADVERTISEMENT
0 votes
Related Articles
Related forms


")


Related Categories
Parent category: Education