Solubility Curve Practice Problems Worksheet Template Page 2
ADVERTISEMENT
 1
1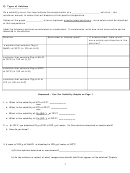 2
2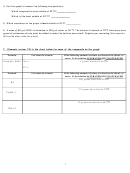 3
3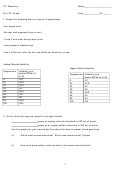 4
42) Types of Solutions
On a solubility curve, the lines indicate the concentration of a __________________ solution - the
maximum amount of solute that will dissolve at that specific temperature.
Values on the graph ____________ a curve represent unsaturated solutions - more solute could be dissolved
at that temperature.
Label the following solutions as saturated or unsaturated. If unsaturated, write how much more solute can be
dissolved in the solution.
Solution
Saturated or Unsaturated?
If unsaturated: How much
more solute can dissolve in the
solution?
a solution that contains 70g of
NaNO
at 30°C (in 100 mL H
O)
3
2
a solution that contains 50g of NH
Cl
4
at 50°C (in 100 mL H
O)
2
a solution that contains 20g of KClO
3
at 50°C (in 100 mL H
O)
2
a solution that contains 70g of KI at
0°C (in 100 mL H
O)
2
Homework – Use the Solubility Graphs on Page 1
_______
1. a. What is the solubility of KCl at 5C?
_______
b. What is the solubility of KCl at 25C?
_______
c. What is the solubility of Ce
(SO
)
at 10C?
2
4
3
_______
d. What is the solubility of Ce
(SO
)
at 50C?
2
4
3
2. a. At 90C, you dissolved 10 g of KCl in 100. g of water. Is this solution saturated or unsaturated?
b. How do you know?
3. A mass of 100 g of NaNO
is dissolved in 100 g of water at 80ºC.
3
a) Is the solution saturated or unsaturated?______________________________
b) As the solution is cooled, at what temperature should solid first appear in the solution? Explain.
2
ADVERTISEMENT
0 votes
Related Articles
Related forms


Related Categories
Parent category: Education