Solubility Curve Practice Problems Worksheet Template Page 4
ADVERTISEMENT
 1
1 2
2 3
3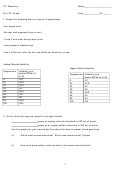 4
4C.P. Chemistry
Name___________________
Part II: Graph
Date___________ Pd. _____
1. Graph the following data on a piece of graph paper.
Your graph must:
-Be neat and organized (use a ruler)
-X and Y axis must have proper scale
-Have properly labeled axes
-Use a different color for the two different solubility curves.
Sodium Chloride Solubility
Copper Sulfate Solubility
Temperature
Solubility (g of
solute/100 mL of
Temperature
Solubility (g of
H
0)
solute/100 mL of H
0)
2
2
0
35.7
0
23
10
35.8
10
27.5
20
35.9
20
32
30
36
30
38
40
36.4
40
44.5
60
37.1
60
62
80
38
80
84
90
38.5
100
114
100
39.2
2. Write the data from your graph in the space below:
_____________
grams of sodium chloride dissolved in 100 mL of water
_____________
grams of or copper sulfate dissolved in 100 mL of water
Use the graph you just created and the above lab data to answer these questions:
a)
Which solution was saturated? Which was unsaturated? Explain.
b)
How much more solute could you add to the unsaturated solution?
4
ADVERTISEMENT
0 votes
Related Articles
Related forms


Related Categories
Parent category: Education