Earth Science Oceanography Tide Activity Using Real Tide Data Page 2
ADVERTISEMENT
 1
1 2
2 3
3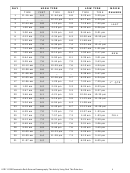 4
4Part 2: Use the graph paper provided to graph the level of the high tides (shaded
column only) in feet for a month. Plot the days of the month on the x-axis), and the
tide level along the y-axis. After you have graphed the tide data answer the questions
below.
1. What kind of patterns does the data reveal? ____________________
2. Tides are cyclic and closely follow the phases of the moon. During the new and full
moons, the distance between the high and low tides increases, which means that
high tides get higher and low tides get lower.
a. From your graph, pick the date that has the highest high tide.
b. What phase of the moon is associated with this high tide?
c. From your graph, pick the date at the second highest peak of high tide.
d. What phase of the moon is associated with this high tide?
e. From your graph, pick the date that has the lowest high tide.
_________
f. What phase of the moon is associated with this high tide?
____
g. From your graph, pick the date that has the second-lowest trough on the curve
for the lowest high tide.
h. What phase of the moon is associated with this high tide?
3. The alignment of the Sun, Moon and Earth affects how high the tides will be. Sketch
the alignment of the Sun, Moon and Earth at new moon.
What is the name for the tides that occur during this alignment?
LORI 16 GB:Documents:Earth Science:Oceanography:Tide Activity Using Real Tide Data.docx
2
ADVERTISEMENT
0 votes
Related Articles
Related forms


Related Categories
Parent category: Education