Local Traffic Survey Worksheet Page 2
ADVERTISEMENT
 1
1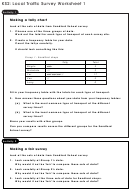 2
2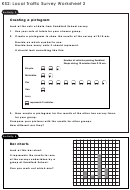 3
3KS2: Local Traffic Survey Worksheet 1
Activity 1
Making a tally chart
Look at the sets of data from Sandford School survey.
1. Choose one of the three groups of data.
Work out the total for each type of transport at each survey site.
2. Create a frequency table for your data.
Count the tallys carefully.
It should look something like this:
Group 1: Sandford shops
Tally
Total
Bicycle
////
5
Motorbike
///
3
Car
//// //// //// //
17
Van
//
2
Lorry
0
Fill in your frequency table with the totals for each type of transport.
3. Now answer these questions about your data from your frequency tables:
(a)
What is the most common type of transport at the different
survey times?
(b)
What is the least common type of transport at the different
survey times?
Share your results with other groups.
Can you compare results across the different groups for the Sandford
School survey?
Activity 2
Making a fair survey
Look at the sets of data from Sandford School survey.
1. Look carefully at Group 1’s data.
Why would it not be ‘fair’ to compare these sets of data?
2. Look carefully at Group 2’s data.
Why would it not be ‘fair’ to compare these sets of data?
3. Look carefully at the three sets of data for Sandford shops.
Why would it not be ‘fair’ to compare these sets of data?
ADVERTISEMENT
0 votes
Related Articles
Related forms


 Threshold Worksheet Template")
 En Espanol: Using Cognitive Interviews To Test The Functional Equivalency Of Questionnaire Translations - U.s. Bureau Of The Census")

Related Categories
Parent category: Education