Local Traffic Survey Worksheet Page 3
ADVERTISEMENT
 1
1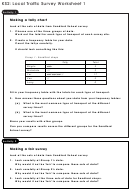 2
2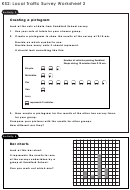 3
3KS2: Local Traffic Survey Worksheet 2
Activity 3
Creating a pictogram
Look at the sets of data from Sandford School survey.
1. Use your sets of totals for your chosen group.
2. Create a pictogram to show the results of the survey at 9.15 am.
Decide on which symbol to use.
Decide how many units it should represent.
It should look something like this:
Number of vehicles passing Sandford
Shops during 15 minutes from 9.15 am.
ic cle
otorbi e
ar
an
orr
represents
vehicles
3. Now create a pictogram for the results of the other two survey times
for your group.
Compare your pictures with the results for other groups.
How different are they?
Activity 4
10
Bar charts
9
Look at this bar chart.
It represents the results for one
of the surveys undertaken by a
group at Sandford School.
Can you work out which one?
1
0
Ca
a
Type of Transport
ADVERTISEMENT
0 votes
Related Articles
Related forms


 Threshold Worksheet Template")
 En Espanol: Using Cognitive Interviews To Test The Functional Equivalency Of Questionnaire Translations - U.s. Bureau Of The Census")

Related Categories
Parent category: Education