Percentiles With The Normal Distribution Curve Worksheet
ADVERTISEMENT
 1
1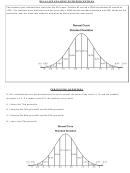 2
2 3
3 4
4NAME:____________________________________________________
DATE:_________
Algebra 2/Trig – Percentiles with the Normal Distribution Curve CLASSWORK
PERIOD:_______
DO NOW
1. On a test that has a normal distribution of scores, a score of 57 falls one standard deviation below the mean,
and a score of 81 is two standard deviations above the mean. Determine the mean score of this test.
Learning Goal: Percentiles with the Normal Distribution Curve
The term percentile refers to the percentage of data that lies at or below a certain score.
For example:
th
- If you are in the 90
percentile for your height, that means 90% of the sample population had a lower
height than you (i.e. you are taller than 90% of the sample population)
th
- If you are in the 65
percentile for SAT scores, that means 65% of the sample population had a lower
score than you (i.e. you scored better than 65% of the sample population).
th
The mean (at the center peak of the curve) is the 50
percentile.
Adding the given percentages from the chart will let you find certain percentiles along the curve.
ADVERTISEMENT
0 votes
Related Articles
Related forms


Related Categories
Parent category: Education