Ionization Energy And The First 20 Elements: Msexcel Activity Page 2
ADVERTISEMENT
 1
1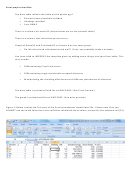 2
2Excel project checklist:
The data table reflects the table on the packet pg 4
o Element names/symbols included
o Headings included
o Your NAME
There is a column for actual IE (actual values are on the periodic table.)
There is a column that calculates percent error.
Graph of Actual IE and Calculated IE vs Atomic # on the same graph
o Do the Actual and calculated match well? If not, you probably made a mistake.
You have tried to IMPROVE the template given by adding some things into your Excel table. This
may include:
o Differentiating P and S electrons
o Differentiating singly and double occupied electrons
o Manipulating the shielding effectiveness of different placements of electrons
The data table is printed off and fits on ONE PAGE. (Use Print Preview)
The graph is printed and fits on ONE PAGE. (Use print preview)
Figure 1: Below is what the first part of the Excel spreadsheet should look like. Please note that you
CANNOT see the math formulas in the cells that calculated these values, except for the selected cell (F3).
ADVERTISEMENT
0 votes
Related Articles
Related forms


")
")


Related Categories
Parent category: Education