Week 34 Growth Chart 0-4 Years Girl Page 2
ADVERTISEMENT
 1
1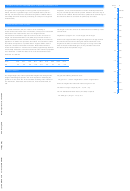 2
2SDS
P
GROWTH CHART FOR PRETERM GIRLS, 34 WEEKS GESTATIONAL AGE
4.0
This growth chart is designed to monitor growth of prematurely born
Physicians, nurses, trained assistants and other medical professionals
P99.99
infants, born after a gestational age of 34 completed weeks (34w.0d −
may use and interpret the chart for preterm children in the same way as
34w.6d). The references were calculated using data of children without
charts for term children. Measurements are plotted at the calender age of
comorbidity other than related to prematurity (for example no congenital
the child since birth. No correction for prematurity is needed.
P99.9
3.0
malformations).
STANDARD DEVIATION SCORES
P99
2.0
The standard deviation (SD) is a measure of the variability of
The length in cm of the child can be transformed into an SDS by means
P97
measurements around the mean. The median (or P50) is the value below
of the formula:
which 50% of the measurements occur. For length and head
circumference the median is equal to the mean, but this is not true for
height SDS = (length in cm − mean length) / SD of length
P90
weight. The standard deviation score (SDS) is equal to the number of
1.0
standard deviations above or below the median (or P50) in the reference
where mean length and SD of length both depend on the age at which
population. An SDS of 0.0 represents the median. A measurement above
the child was measured. The table given below contains the mean
P75
the median corresponds to a positive SDS. A negative SDS is used to
length and the SD at a number of exact ages. If the age of the child
represent a measurement below the median. Most children will have
does not match the tabulated ages, we may calculate values from
measurements between −2.0 SDS and +2.0 SDS (approximately between
the table by linear interpolation of age.
P2 and P98). About 0.6% of the measurements in the reference population
0.0
P50
occur below the −2.5 SD line. About 0.1% of the measurements occur
below the −3.0 SD line.
P25
Age
0.0
0.5
1.0
1.5
2.0
2.5
3.0
3.5
4.0
−1.0
Mean
44.6
63.7
73.8
80.7
86.5
91.6
96.2
100.4
104.2
P10
SD
2.4
2.4
2.6
2.9
3.2
3.5
3.7
4.0
4.2
P3
TARGET HEIGHT
−2.0
P1
The Target Height (TH) is the expected final height of the child given the
For girls, the following formula is used:
height of both biological parents. The TH is important in evaluating the
growth curve of a child. The TH is calculated according to the method of
TH girl = 47.1 + 0.334 * height father + 0.364 * height mother
Van Dommelen, Schonbeck and Van Buuren, Arch Dis Child 2012, 97:
−3.0
P0.1
182.
where the height of the father and mother are given in cm.
The 95% TH−range is equal to [TH − 10; TH + 10].
P0.01
The TH−Standard Deviation Score (TH−SDS) is equal to
−4.0
TH−SDS girl = (TH girl − 170.7) / 6.3
TNODIAGRAM by Stef van Buuren
TNODIAGRAM by Stef van Buuren
ADVERTISEMENT
0 votes
Related Articles
Related forms


Related Categories
Parent category: Life