Linear Equations
ADVERTISEMENT
 1
1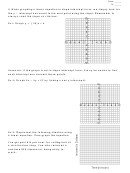 2
2 3
3Date: _____
N: _____
Essential Question: I. How do we write linear equations given a graph?
II. How do we graph linear equations?
Homework: Worksheet
Ticket out the Door: NO
I. The simplest mathematical model for relating two variables is the linear
equation in two variables y = mx + b where m represents the slope and b
represents the y-intercept.
m =
b:
When given a graph, we can simply count
the slope from the point to the left to the
point to the right. In the example below,
start at the y-intercept (0, -5) and count to
exactly
the next point that hits
on another
grid mark.
The point is (3, -3). So, the slope between
(0, -5) and (3, -3) is
3
(
) 5
2
m =
=
3
0
3
and the intercept is b = -5.
Therefore, the equation is y = (2/3)x – 5.
Ex1: Match the equation with each graph below.
a) y = x
b) y = -(2/3)x + 7
c) y = 4
d) y = -x
e) y = 3x – 5
ADVERTISEMENT
0 votes
Related Articles
Related forms


Related Categories
Parent category: Education