Interpreting Chart Data Worksheet Page 2
ADVERTISEMENT
 1
1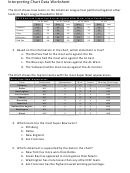 2
2Interpreting Chart Data Worksheet
The chart shows how teams in the American League East performed against other
teams in Major League Baseball in 2012.
2012 American League East Records Against other Major League Baseball Teams
vs. AL East
vs. AL Central
vs. AL West
vs. NL
Win
Loss
Win
Loss
Win
Loss
Win
Loss
Yankees
41
31
21
16
20
15
13
5
Orioles
43
29
23
15
16
18
11
7
Rays
41
31
16
18
24
14
9
9
Blue Jays
29
43
21
16
14
21
9
9
Red Sox
26
46
24
16
8
24
11
7
Source:
3. Based on the information in the chart, which statement is true?
a. The Red Sox had to the most wins against the NL.
b. The Orioles had the most wins against the AL East.
c. The Blue Jays had the most losses against the AL West.
d. The Yankees had the most losses against the AL Central.
The chart shows the top ten teams with the most Super Bowl appearances.
Most Super Bowl Appearances
Team
Conference
Appearances
Wins
Losses
Winning Percentage
Pittsburg
AFC
8
6
2
.750
Dallas
NFC
8
5
3
.625
New England
AFC
7
3
4
.429
San Francisco
NFC
6
5
1
.833
Denver
AFC
6
2
4
.333
Green Bay
NFC
5
4
1
.800
New York
NFC
5
4
1
.800
Oakland/Los Angeles
AFC
5
3
2
.600
Washington
NFC
5
3
2
.600
Miami
AFC
5
2
3
.400
Source:
4. Which team has the most Super Bowl wins?
a. Pittsburg
b. Dallas
c. New England
d. San Francisco
5. Which statement is supported by the data in the chart?
a. New York has more wins than Dallas.
b. Green Bay has appeared in more games than Miami.
c. Washington has more losses than any other NFC team.
d. San Francisco has the highest overall winning percentage.
ADVERTISEMENT
0 votes
Related Articles
Related forms


Related Categories
Parent category: Education