Income And Expenditure Economics Worksheets
ADVERTISEMENT
 1
1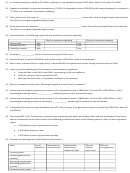 2
2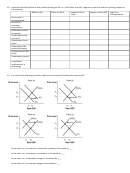 3
3Unit 3 Exam Review
Income and Expenditure
Formulas to Know:
1.
Figure MPC and MPS.
MPC =
2.
Explain relationship between MPC and the multiplier.
3.
List and understand reasons for shifts in consumption graph.
MPS =
4.
Figure the multiplier and the resulting impact of autonomous changes in spending.
Consumer/government spending
5.
Figure and graph the consumption function. How is MPC represented on the graph?
multiplier =
Aggregate Supply & Aggregate Demand
Consumption function =
6.
Define aggregate supply and aggregate demand.
7.
List and understand reasons for shifts of the AS and AD curves.
Tax Multiplier =
8.
Identify results of AD and AS shifts on:
a.
Employment/unemployment
b.
Price level
c.
Real GDP
9.
Explain why the AD curve is downward sloping.
10. Explain why the SRAS and LRAS curves are sloped as they are.
11. Define sticky wages and relationship with aggregate supply.
The AD-AS Model
12. Determine the impact of market conditions on SRAS, LRAS and the PPC.
13. Define and understand potential output’s (Y
) relationship with the AD-AS Model.
P
14. Identify and graph inflationary and recessionary gaps.
15. Define stagflation and identify its effects on the economy.
Long-Run Macroeconomic Equilibrium & Government Policy
16. Explain the differences between automatic and discretionary stabilization.
17. Give examples of automatic stabilizers.
18. Compare multiplier effects of fiscal policy options.
19. Evaluate fiscal policy options to combat recessions and inflation. (Which government actions are likely to be most effective?)
20. List examples of government transfers.
21. Explain the difference in multiplier effects between the spending and tax multiplier.
22. Explain why MPC + MPS + taxes = 1.
Practice Questions
23. Complete this chart.
Income
Expenditures
MPC
MPS
$0
$8,000
N/A
N/A
$20,000
$11,000
$40,000
$25,000
$60,000
$35,000
$80,000
$41,000
What is the autonomous consumer spending?
24. Determine the multiplier and the net effect of the following autonomous changes in spending:
a.
An influx of $100 billion in government spending when the marginal propensity to consume is 0.75.
b.
An influx of $250 billion in business investment when the marginal propensity to consume is 0.5.
c.
An influx of $180 billion in export sales revenue when the marginal propensity to consume is 0.8.
ADVERTISEMENT
0 votes
Related Articles
Related forms


")


Related Categories
Parent category: Education