Spectroscopic Tables
ADVERTISEMENT
 1
1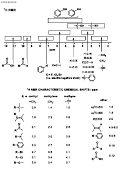 2
2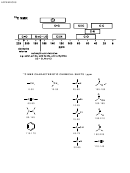 3
3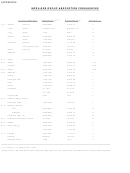 4
4APPENDICES
SPECTROSCOPIC TABLES
The following pages contain some basic spectroscopic data tables.
(1) Schematic diagrams of NMR chemical shift data for H
Both the schematic figure and the table show similar information presented in different ways. Both have their merits.
They show the typical chemical shifts for protons being influenced by a single group.
In cases where a proton is
influenced by more than one group, the effects are essentially cumulative, for example proton shift in CH
Cl is at
3
approximately 3.1ppm while CH
Cl
= 5.3ppm.
2
2
13
(2) Schematic diagrams of NMR chemical shift data for
C
Like the proton NMR diagrams, the figure and the table show similar information presented in different ways and both
have their merits. They show the typical chemical shifts for carbon atoms being influenced by a single group. The effects
of multiple groups is a little more complex and is therefore less predictable than seen in H-NMR, but often the effects are
cumulative.
(3) Infra Red absorption frequencies
Typical ranges of absorption frequencies are provided. In individual cases, the specific frequency observed is affected by
a variety of factors including the particular structure of the sample molecule and the nature of the sample preparation (e.g.
nujol mull vs thin film vs solid disc).
ADVERTISEMENT
0 votes
Related Articles
Related forms


Related Categories
Parent category: Education