Spearman'S Rank Correlation Coefficient Page 2
ADVERTISEMENT
 1
1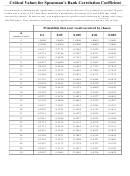 2
2Critical Values for Spearman’s Rank Correlation Coefficient
Use this table to determine the significance of your result for this test. For example, if you had 20 pairs
of data and a value of 0.53 then there would be a probability of between 0.01 and 0.005 that it had
occurred by chance. In other words, you might expect to get this result occurring by chance once every
100-200 times. This, therefore, indicates a very significant correlation between the two sets of data.
Probability that your result occurred by chance
n
0.1
0.05
0.025
0.01
0.005
(number of pairs)
4
1.0000
1.0000
1.0000
1.0000
1.0000
5
0.7000
0.9000
0.9000
1.0000
1.0000
6
0.6571
0.7714
0.8286
0.9429
0.9429
7
0.5714
0.6786
0.7857
0.8571
0.8929
8
0.5476
0.6429
0.7381
0.8095
0.8571
9
0.4833
0.6000
0.6833
0.7667
0.8167
10
0.4424
0.5636
0.6485
0.7333
0.7818
11
0.4182
0.5273
0.6091
0.7000
0.7545
12
0.3986
0.5035
0.5874
0.6713
0.7273
13
0.3791
0.4780
0.5604
0.6484
0.6978
14
0.3670
0.4593
0.5385
0.6220
0.6747
15
0.3500
0.4429
0.5179
0.6000
0.6536
16
0.3382
0.4265
0.5029
0.5824
0.6324
17
0.3271
0.4124
0.4821
0.5577
0.6055
18
0.3170
0.4000
0.4683
0.5425
0.5897
19
0.3077
0.3887
0.4555
0.5285
0.5751
20
0.2992
0.3783
0.4438
0.5155
0.5614
21
0.2914
0.3687
0.4329
0.5034
0.5487
22
0.2841
0.3598
0.4227
0.4921
0.5368
23
0.2774
0.3515
0.4132
0.4815
0.5256
24
0.2711
0.3438
0.4044
0.4716
0.5151
25
0.2653
0.3365
0.3961
0.4622
0.5052
26
0.2598
0.3297
0.3882
0.4534
0.4958
27
0.2546
0.3233
0.3809
0.4451
0.4869
28
0.2497
0.3172
0.3739
0.4372
0.4785
29
0.2451
0.3115
0.3673
0.4297
0.4705
30
0.2407
0.3061
0.3610
0.4226
0.4629
ADVERTISEMENT
0 votes
Related Articles
Related forms


Related Categories
Parent category: Education