'Interpreting Weather Symbols - The Visual Language Of Weather' Geography Worksheet
ADVERTISEMENT
 1
1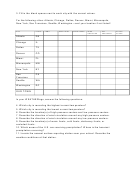 2
2Name ____________________________________________ Date __________
Activity 3.2.2
Interpreting Weather Symbols—the visual language of
weather
Objectives
To decode symbols appearing on a surface weather map and describe weather
conditions at various locations on the map.
Materials
• Student Worksheet 3.3.1 Weather Symbols
• Student Worksheet 3.3.2 Interpreting Weather Symbols—the visual language
of weather (this sheet)
• atlas or other U.S. maps showing major cities
• pencil
• current U.S. weather map
Procedure
1. Look at the current U.S. weather maps and review Activity 3.3.1 and 3.3.2
worksheets.
2. Use the symbol key on 3.3.1 to determine the current surface weather
conditions reported at each city on the list.
Rules for representing current conditions on a surface weather map:
• Each surface station is designated as a circle on the weather map.
• Current temperature in degrees Fahrenheit is displayed at the 11 o’clock
position.
• Dew point is displayed at the 8 o’clock position.
• Precipitation type is displayed at the 9 o’clock position.
• Air pressure, reported to the nearest tenth of a millibar, is displayed at the 1
o’clock position. To read the air pressure, place a decimal point between the
second and third number. Then add a 9 or 10 to the left so the resulting air
pressure falls between 960 mb and 1050 mb.
• Wind direction is displayed as a shaft extending out from the circle and
pointing in the direction from which the wind blows.
• Wind speed is displayed by the number of feathers or a pennant drawn on the
clockwise side of the shaft.
• Sky coverage is displayed by the percentage of the circle that is shaded in.
ADVERTISEMENT
0 votes
Related Articles
Related forms


Related Categories
Parent category: Education