Investment Agreement Template Page 4
ADVERTISEMENT
 1
1 2
2 3
3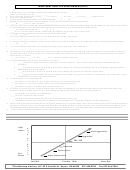 4
4INVESTMENT OBJECTIVE QUESTIONNAIRE (cont.)
1.
What percentage of your investable assets does this managed account represent? ___________%
What is your estimated net worth? ________________
2.
How much investing experience do you have?______ no experience ______1 to 5 years ______5 to 10 years ______longer than 10yrs.
3.
What is your marginal tax rate? ________________
4.
Do you have other managed accounts, or own stocks individually?______Yes ______No
5.
Although investment performance is not guaranteed, do you have an annual total return in mind for the portfolio?
______ No ______Yes, If yes, what is the return? ________________
6.
Total return is the sum of dividends, interest and capital appreciation. Generally, the greater the emphasis on high income (dividends and interest only), the less potential
for capital appreciation. Do you have any specific requirements for annual income to be earned from this managed account?
______ Yes. Please indicated the rate
______ % or $ ________
_____ No. It is up to the investment advisor to determine the appropriate portion of income return for the portfolio.
7.
Are there any quality restrictions for the fixed income instruments in the portfolio?
______No ______Yes
If yes, please indicate specific quality levels (e.g., Standard and Poor’s or Moody’s bond ratings)
___________________________________________
8.
Are there any constraints on holding any specific security or industry group within the portfolio or any tax or legal issues related to the portfolio’s investment holdings?
______ No ______Yes
9.
If yes, please indicate securities that are not acceptable for holding in the portfolio and/or other related issues.
__________________________________________
10. The time horizon used in evaluating investment return has significant impact on the probability of realizing the stated return objectives. The longer the time period, the
better the chance that up and down market cycles will average out and your desired return can be achieved. Please check the investment time horizon that seems most
appropriate for your account.
______10 yrs. or more ______ 5 to 10 yrs. ______ 3 to 5 yrs (usually a complete market cycle)
11. My investment objective for this portfolio over a market cycle would be:
A.
______Preservation of capital and returns exceeding those of risk-free investments. (A low risk level means the portfolio is subject to minimal price
fluctuations.)
B.
______A combination of modest growth of capital and income via high-quality investments. (Diversification and risk control through a balanced portfolio of
stocks, bonds and/or cash equivalents.)
C.
______Growth of capital. (Exposure to increased levels of price volatility with expectations to outperform an equity index.)
D.
______Aggressive growth of capital. (Exposure to yet higher levels of volatility with a greater expectation for outperforming a growth equity index. Income
is incidental and not a major investment consideration.)
12. Investment volatility you are comfortable with:
______Can tolerate more than one to two years of negative absolute returns in difficult market cycles.
______Can tolerate 4 to 5 quarters of negative absolute returns through difficult market cycles.
______Can tolerate infrequent, very moderate losses through a market cycle.
13. An increase in investment total return is usually associated with an increase in the acceptable level of fluctuation of the portfolio market value during market cycles.
Investment “risk” can be defined in different ways. Please indicate the single item that best describes how you tend to describe risk.
______The possibility of not achieving my established goals.
______Not at least equaling the rate of inflation
______High degree of fluctuation in the market value of the total portfolio within a market cycle.
______The chance of a great loss in market cycle of an individual security regardless of how well the total portfolio of securities might perform.
14. This risk/return graph compares the historical risk vs. performance relationship of several market indices. The vertical axis indicates rates of return, and the horizontal axis
indicates risk. The further right your portfolio falls on the graph, the more volatility it is likely to undergo in periodic returns. The closer to the top, the higher the return.
The relationships indicated here generally reflect a complete market cycle. Please put an “X” in the section (Chart Below) which best fits your investment objectives.
15.
Please provide any additional information you feel is relevant to the management of this portfolio
High
R
Return
a
More Aggressive
t
e
Aggressive
o
f
S&P 500
R
e
Balanced
t
u
Conservative
r
Low
n
More Conservative
Return
Less Risk
Volatility (Risk)
More Risk
Tillar-Wenstrup Advisors, LLC 92 E. Franklin St. Dayton, OH 45459
937-428-9700
Fax 937-436-7504
ADVERTISEMENT
0 votes
Related Articles
Related forms


Related Categories
Parent category: Business