Meteorology Worksheet Page 2
ADVERTISEMENT
 1
1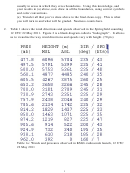 2
2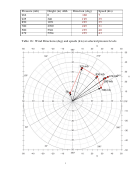 3
3 4
4usually in areas in which they cross boundaries. Using this knowledge, and
your results in (a) above, now draw in all the boundaries, using correct symbols
and color conventions.
(e) Transfer all that you’ve done above to the final clean copy. This is what
you will turn in and what will be graded. Neatness counts here.
2.
Table 1 shows the wind directions and speeds observed in the Springfield sounding
12 UTC 22 May 2011. Figure 2 is a blank diagram called a “hodograph” . It allows
us to visualize the way wind directions and speeds vary with height. (70 pts)
Table 1a: Winds and pressures observed in KSGL radiosonde launch, 12 UTC
22 May 2011
2
ADVERTISEMENT
0 votes
Related Articles
Related forms


 Worksheet A - Residency Information Worksheet For Nonresidents/part-year Residents, Worksheet B - Income Allocation Worksheet For Nonresidents/part-year Residents, Worksheet C - Employee Apportionment Worksheet
Financial
Worksheet A - Residency Information Worksheet For Nonresidents/part-year Residents, Worksheet B - Income Allocation Worksheet For Nonresidents/part-year Residents, Worksheet C - Employee Apportionment Worksheet
Financial
 - Residency Information Worksheet For Part-year Residents/nonresidents/") Worksheet A/worksheet B (form 1040me) - Residency Information Worksheet For Part-year Residents/nonresidents/"safe Harbor" Residents/income Allocation Worksheet For Part-year Residents/nonresidents/"safe Harbor" Residents
Financial
Worksheet A/worksheet B (form 1040me) - Residency Information Worksheet For Part-year Residents/nonresidents/"safe Harbor" Residents/income Allocation Worksheet For Part-year Residents/nonresidents/"safe Harbor" Residents
Financial
 Worksheet Ct-1040aw - Part-year Resident Income Allocation Worksheet, Employee Apportionment Worksheet - 1998
Financial
Worksheet Ct-1040aw - Part-year Resident Income Allocation Worksheet, Employee Apportionment Worksheet - 1998
Financial
 - Standard Deduction, Worksheet Vi-qmip - Qualified Mortgage Insurance Premiums Deduction, Worksheet Vi-idl - Itemized Deduction Limitation - 2014") Worksheet V (form 2) - Standard Deduction, Worksheet Vi-qmip - Qualified Mortgage Insurance Premiums Deduction, Worksheet Vi-idl - Itemized Deduction Limitation - 2014
Financial
Worksheet V (form 2) - Standard Deduction, Worksheet Vi-qmip - Qualified Mortgage Insurance Premiums Deduction, Worksheet Vi-idl - Itemized Deduction Limitation - 2014
Financial
 Worksheet A And B - Residency Information Worksheet For Part-year Residents/nonresidents/"safe Harbor" Residents/income Allocation Worksheet For Part-year Residents/nonresidents/"safe Harbor" Residents
Financial
Worksheet A And B - Residency Information Worksheet For Part-year Residents/nonresidents/"safe Harbor" Residents/income Allocation Worksheet For Part-year Residents/nonresidents/"safe Harbor" Residents
Financial


Related Categories
Parent category: Education