Math Classroom Activity Sheet Page 2
ADVERTISEMENT
 1
1 2
2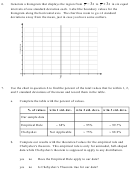 3
3 4
43.
Describe the context of the data.
4.
Generate a box plot of the time vs the heat number.
a.
Do the average times seem to be getting faster? How can you tell from the
box plots?
b.
Do the times seem to be getting more consistent? How can you tell from the
box plots?
5.
Summarize the time variable. Do this for each heat as well as the combined data.
Heat
1
2
3
All
Sample Size
Mean
Median
Standard Deviation
ADVERTISEMENT
0 votes
Related Articles
Related forms


 Sheet")


Related Categories
Parent category: Education