Math Classroom Activity Sheet Page 3
ADVERTISEMENT
 1
1 2
2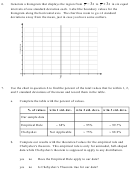 3
3 4
4−
+
y
3
s
y
3
s
6.
Generate a histogram that displays the region from
to
in six equal
intervals of one standard deviation each. Label the boundary values for the
histogram along the horizontal axis. The chart has room to go ±4 standard
deviations away from the mean, just in case you have some outliers.
7.
Use the chart in question 6 to find the percent of the total values that lie within 1, 2,
and 3 standard deviations of the mean and record them in the table.
a.
Complete the table with the percent of values.
% of values
w/in 1 std. dev.
w/in 2 std. devs. w/in 3 std. devs.
Our sample data
. 68%
. 95%
. 99.7%
Empirical Rule
$ 75%
$ 88.9%
Chebyshev
Not Applicable
b.
Compare our results with the theoretical values for the empirical rule and
Chebyshev's theorem. This empirical rule is only for unimodal, bell-shaped
data while Chebyshev's theorem is supposed to apply to any distribution.
yes
no
Does the Empirical Rule apply to our data?
yes
no
Is Chebyshev's Theorem true for our data?
ADVERTISEMENT
0 votes
Related Articles
Related forms


 Sheet")


Related Categories
Parent category: Education