Reading A Bar Graph Worksheet With Answer Key Page 15
ADVERTISEMENT
 1
1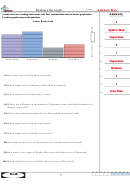 2
2 3
3 4
4 5
5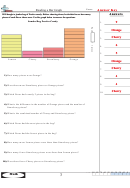 6
6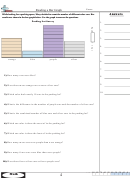 7
7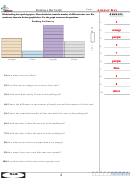 8
8 9
9 10
10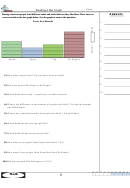 11
11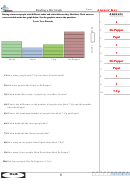 12
12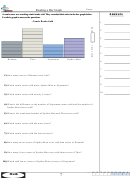 13
13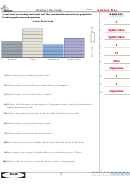 14
14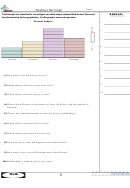 15
15 16
16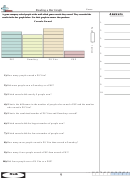 17
17 18
18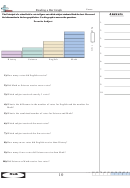 19
19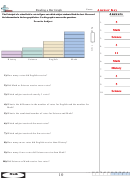 20
20Name:
Reading a Bar Graph
The Principal of a school held a vote to figure out which subject students liked the best. He record
A n s w e r s
his information in the bar graph below. Use his graph to answer the questions.
Favorite Subject
9
1.
History
2.
Reading
3.
3
4.
15
5.
Science
English
History
Reading
History
6.
Science
7.
1) How many votes did History receive?
2
8.
3
9.
2) Did Reading or History receive more votes?
English
10.
3) Which subject received exactly 6 votes?
4) What is the difference in the number of votes for History and the number for
Reading?
5) What is the combined number of votes for History and Reading?
6) Which subject received the most votes?
7) Which subject received the fewest votes?
8) How many more votes did English receive than Science?
9) How many fewer votes did Reading receive than History?
10) Did Reading or English receive less votes?
90 80 70 60 50 40 30 20 10 0
1-10
8
Math
ADVERTISEMENT
0 votes
Related Articles
Related forms


Related Categories
Parent category: Education