Reading A Bar Graph Worksheet With Answer Key Page 7
ADVERTISEMENT
 1
1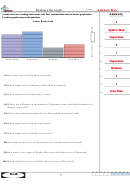 2
2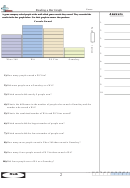 3
3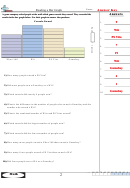 4
4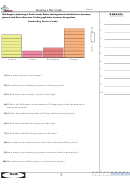 5
5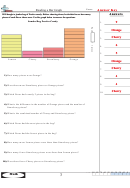 6
6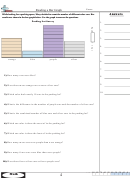 7
7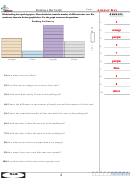 8
8 9
9 10
10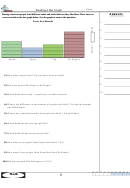 11
11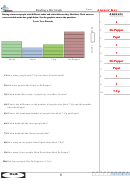 12
12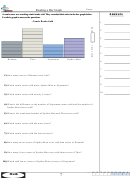 13
13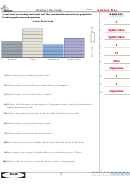 14
14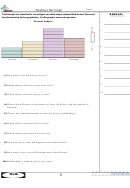 15
15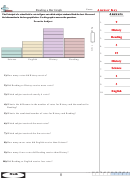 16
16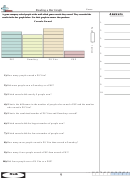 17
17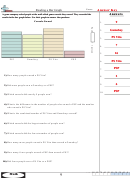 18
18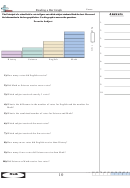 19
19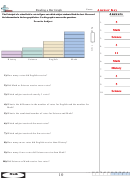 20
20Name:
Reading a Bar Graph
While looking for a parking space, Mary decided to count the number of different color cars. Her
A n s w e r s
results are shown in the bar graph below. Use the graph to answer the questions.
Parking Lot Survey
2
1.
orange
2.
purple
3.
5
4.
7
5.
orange
blue
purple
silver
purple
6.
blue
7.
1) How many cars were blue?
4
8.
8
9.
2) Were there more orange cars or more silver cars?
silver
10.
3) Which color had exactly 10 cars in the parking lot?
4) What is the difference in the number of purple cars and the number of silver cars?
5) What is the combined number of blue cars and silver cars in the parking lot?
6) Which car color is there the most of in the parking lot?
7) Which car color is there the least of in the parking lot?
8) How many more cars were purple than were orange?
9) How many fewer cars were blue than were purple?
10) Were there fewer silver cars or fewer purple cars?
90 80 70 60 50 40 30 20 10 0
1-10
4
Math
ADVERTISEMENT
0 votes
Related Articles
Related forms


Related Categories
Parent category: Education