Journey Of The Blood Page 2
ADVERTISEMENT
 1
1 2
2 3
3 4
4 5
5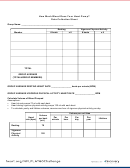 6
6o 8.SP.A1-4 Investigate patterns of association in bivariate data.
Materials
The Journey of Blood reading passage
•
How Much Blood Does Your Heart Pump? handout
•
How Much Blood Does Your Heart Pump? Data Collection Sheet
•
Calculator
•
Computers with Internet access
•
NSTA: Peer-review sheet used by students during the double-blind peer review
•
[https://
Procedure:
ENGAGE
1. Choose a student and ask when he or she last drank a bottle of water.
2. Ask another student the volume of a regular bottle of water. (A regular bottle of water holds 20 fluid ounces or 591
ml.)
3. Ask students to write a sentence comparing the size of a bottle of water to the size of their fist.
4. Ask students to make a fist and place it on the chest where the heart is located.
1
5. Explain that the heart is only about the size of their fist,
but it is responsible for pumping blood to all parts of the
body. Explain to students that they will investigate the journey of blood and calculate how much blood their heart
pumps in given amounts of time.
EXPLORE
1. Students read the reading passage The Journey of Blood.
2. Explain to students that their task is to calculate quantify and illustrate the volume of blood pumped by the heart over
various time periods.
3. Ask students the guiding question, “How can you visualize the volume of blood that the heart pumps in an hour, in a
day, over a longer period of time?”
4. Students work in small groups to complete the hands-on activity, using the How Much Blood Does Your Heart
Pump? handout and the How Much Blood Does Your Heart Pump? Data Collection Sheet.
5. Students use their data to calculate the volume of blood pumped by the heart in various time periods.
EXPLAIN
1. Still in groups, students develop answers to the guiding question, “How can you illustrate the volume of blood that
the heart pumps in an hour, in a day, and over a longer period of time?” Ensure that groups’ explanations focus on
how to illustrate the volume of blood pumped by the heart in various time periods.
2. Lead a class discussion of the core idea that there are various ways to present quantitative data.
3. Encourage groups to consider ways to improve the investigation based on scientific inquiry.
4. Each group creates a visual graphic organizer (e.g., concept map, slide presentation, research poster) to present
their data. (Data will vary due to different pulse rates measured in the activity.) Encourage groups to use alternative
units to express the data. For example, students could present volume of blood pumped in a day in units of water
1
C leveland C linic H eart F acts
h
ADVERTISEMENT
0 votes
Related Articles
Related forms


")

 Chord Chart")


Related Categories
Parent category: Education