Heath Information Technology Commission Report - Fy2010 Appropriation Bill - Michigan Department Of Community Health Page 31
ADVERTISEMENT
 1
1 2
2 3
3 4
4 5
5 6
6 7
7 8
8 9
9 10
10 11
11 12
12 13
13 14
14 15
15 16
16 17
17 18
18 19
19 20
20 21
21 22
22 23
23 24
24 25
25 26
26 27
27 28
28 29
29 30
30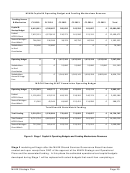 31
31 32
32 33
33 34
34 35
35 36
36 37
37 38
38 39
39 40
40 41
41 42
42 43
43 44
44 45
45 46
46 47
47 48
48 49
49 50
50 51
51 52
52 53
53 54
54 55
55 56
56 57
57 58
58 59
59 60
60 61
61 62
62 63
63 64
64 65
65 66
66 67
67 68
68 69
69 70
70 71
71 72
72 73
73 74
74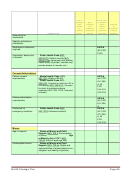 75
75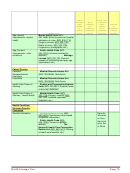 76
76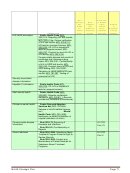 77
77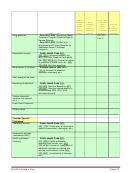 78
78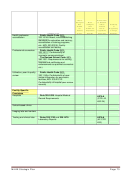 79
79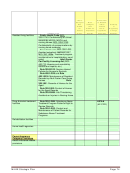 80
80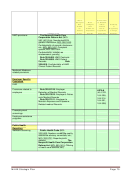 81
81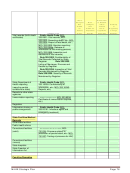 82
82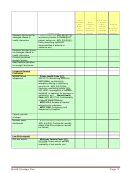 83
83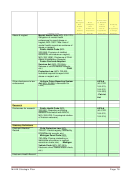 84
84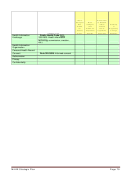 85
85 86
86 87
87MiHIN Capital & Operating Budget and Funding Mechanisms Revenue
Funding Source
& Mechanism
CY‐2010
CY‐2011
CY‐2012
CY‐2013
CY‐2014
CY‐2015
Total
Capital &
8,419,811
4,768,607
268,650 242,250
181,687
0 13,881,005
Startup Budget
Federal
7,607,151 4,379,419
230,271 161,500
121,131
0 12,499,472
HITECH Grant
State of Michigan
786,260
336,388 38,379 80,750
60,556
0
1,302,333
Grant Match
Stakeholders
26,400
52,800
0
0
0
0
79,200
In‐Kind
Contribution
Operating Budget
0
0
1,617,182
1,635,945
1,879,158 1,935,641
7,067,926
Stakeholders
0
0
52,800
52,800
52,800
52,800
211,200
In‐Kind
Contribution
Stakeholders
0
0
1,564,382
1,583,145
1,826,358 1,882,841
6,856,726
Access & Usage
Fees
MDCH Planning & HIT Commission Operating Budget
Operating Budget
1,116,843
468,277
471,035
470,832
355,170
0
2,882,157
Federal
1,105,603
423,233
406,195
318,381
240,174
0
2,493,586
HITECH Grant
State of Michigan
11,240
45,044
64,840
152,451
114,996
0
388,571
Grant Match
Total Grant & State Match Funding
Total Funding
9,510,254
5,236,884
739,685
713,082
536,857
0 16,736,762
Total Federal
8,712,754
4,802,652
636,466
479,881
361,305
0 14,993,058
HITECH Grant
State of Michigan
797,500
381,432
103,219
233,201
175,552
0
1,690,904
Grant Match
Figure 5. Stage 1 Capital & Operating Budgets and Funding Mechanisms Revenues
Stage 2 modeling will begin after the MiHIN Shared Services Governance Board has been
created and upon receipt from ONC of the approval of the MiHIN Strategic and Operational
Plans and the associated funding. In this phase the estimated operational and capital budgets
developed during Stage 1 will be replaced with actual budgets that result from completing a
MiHIN Strategic Plan
Page 25
ADVERTISEMENT
0 votes
Related Articles
Related forms
 Application Form For Registration Of Minor Patient Form - Michigan Department Of Community Health
Medical
Application Form For Registration Of Minor Patient Form - Michigan Department Of Community Health
Medical
 Verification Of Pregnancy And Gestational Age Form - Local Health Department Michigan Department Of Community Health
Legal
Verification Of Pregnancy And Gestational Age Form - Local Health Department Michigan Department Of Community Health
Legal


 Form Dch-0479 - Kindergarten Entry/preschool Hearing/vision Screening Record - Michigan Department Of Community Health
Legal
Form Dch-0479 - Kindergarten Entry/preschool Hearing/vision Screening Record - Michigan Department Of Community Health
Legal
 Form Vs-165 - Information On Suit Affecting The Family Relationship - Texas Department Of State Health Services
Legal
Form Vs-165 - Information On Suit Affecting The Family Relationship - Texas Department Of State Health Services
Legal


Related Categories
Parent category: Legal