Population Trends - Tanzania - Bureau Of The Census - 1995 Page 3
ADVERTISEMENT
 1
1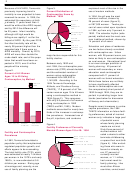 2
2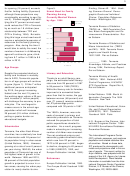 3
3 4
43
for spacing (18 percent) exceeds
Sinding, Steven W. 1994. S eek-
Figure 5.
that for limiting fertility (9 percent)
in g C ommo n G round : D emo-
Unmet Need for Family
although these proportions vary
graphi c G oal s a n d I ndividual
Planning Among
considerably according to age (fig-
Choice . Population Reference
Currently Married Women
ure 5). Studies suggest that satis-
Bureau. Washington, DC.
by Age: 1994
Spacing
fying this 27 percent unmet need
Limiting
could reduce the TFR in Tanzania
Tanzania Bureau of Statistics.
Age
by as much as 1.8 children (see
(TBOS) nd. 198 8 P opulatio n C en-
15–19
relationship between TFR and
sus , B asi c D emographi c a n d S o-
20–24
CPR in Sinding, 1994). But satis-
cioeconomi c C haracteristics. Dar
fying this large unmet need would
es Salaam.
25–29
require a substantial expansion of
resources for the family planning
30–34
Tanzania Bureau of Statistics and
program. Also, during the time it
Macro International Inc. (TBOS
would take to satisfy the need, the
35–39
and MII). 1993. Tanzani a D emo-
number of women in childbearing
graphi c a n d H ealt h S urvey
40–44
ages will continue to grow, climb-
1991/1992. Dar es Salaam.
ing from 6.7 million in 1995 to 8.5
45–49
million in 2010.
. 1995. Tanzania
0
5
10 15 20 25 30 35 40
Knowledge , A ttitude , a n d P ractices
Percent
Surve y 1 994 , P reliminar y R eport.
Age Groups
Dar es Salaam.
Despite the projected decline in
Literacy and Education
fertility and increase in mortality
Tanzania Ministry of Health
Thanks to an adult literacy cam-
due to AIDS, Tanzania’s popula-
(TMOH). 1994. Nationa l A IDS
paign, the estimated adult literacy
tion in all age groups will continue
Contro l P rogramme , H IV/AIDS/
rate rose from 28 percent in 1967
to grow (figure 1). Of the 7 million
ST D S urveillance . Report No. 8,
to 59 percent in 1988 (TBOS).
additional persons anticipated
Dar es Salaam.
While the literacy rate for females
by 2010, the group increasing
improved at a somewhat faster
fastest over the next 15 years is
United Nations. 1995. Worl d U r-
pace than that for males, the gap
the working ages, where a 30-per-
banizatio n P rospects Th e 1 994
between women (48 percent) and
cent increase (4 million people)
Revision . New York.
men (71 pecent) remains substan-
will challenge the economy to pro-
tial, 23 percentage points
vide jobs. The next largest in-
United Nations Educational, Scien-
compared with 30 points in 1967.
crease occurs in the school age
tific, and Cultural Organization
population which will increase
(UNESCO). 1991. S tatistical
The 1980’s, however, was a de-
25 percent (2.5 million children),
Yearboo k 1 992. Paris.
cade of reversal in primary and
putting a greater burden on
secondary education as Tanzania
educational budgets.
reduced the proportion of total
U.S. Bureau of the Census, Inter-
public expenditures devoted to
national Programs Center. 1994.
education. As a result, progress
Urbanization
HIV/AIDS Surveillance Database.
made in educating an increasing
December Release.
Tanzania, like other East African
number of children was reversed.
countries, has a relatively low level
The net combined primary and
The International Programs Center
of urbanization with 24 percent of
secondary grade enrollment ratio,
(IPC) collects, assesses, and analyzes
its population living in urban areas
which rose from 22 percent in
population and related statistics from
(United Nations, 1995). However,
1970 to 58 percent in 1981, began
all countries. Based on these data,
IPC produces the demographic esti-
growing at a rate of over 6 percent
to decline, dropping to 40 percent
mates and projections used in this se-
per year during 1990-95, the urban
in 1989 (UNESCO, 1992, and
ries of reports. This report, written by
population of Tanzania has one of
Europa Publication Limited, 1993).
Arjun Adlakha, was prepared with the
the highest rates of growth in the
support of the U.S. Agency for Interna-
world. Between 1995 and 2010,
References
tional Development. More detailed
86 percent of the total population
information is available from the Inter-
growth is projected to occur in ur-
Europa Publication Limited, 1993.
national Programs Center, Population
Th e E urop a W orl d Y earboo k 1 993 .
ban areas, causing the urban pop-
Division, U.S. Bureau of the Census,
ulation to nearly double its size.
London.
Washington, DC, 20233–8860.
ADVERTISEMENT
0 votes
Related Articles
Related forms
 Ib/99-1 International Brief - Population Trends: Peru - U.s. Department Of Commerce - Bureau Of The Census - 1999
Legal
Ib/99-1 International Brief - Population Trends: Peru - U.s. Department Of Commerce - Bureau Of The Census - 1999
Legal
 En Espanol: Using Cognitive Interviews To Test The Functional Equivalency Of Questionnaire Translations - U.s. Bureau Of The Census") Survey Methodology #2003-17 - The American Community Survey (acs) En Espanol: Using Cognitive Interviews To Test The Functional Equivalency Of Questionnaire Translations - U.s. Bureau Of The Census
Legal
Survey Methodology #2003-17 - The American Community Survey (acs) En Espanol: Using Cognitive Interviews To Test The Functional Equivalency Of Questionnaire Translations - U.s. Bureau Of The Census
Legal
 Form Pd F 3500 E - Continuation Sheet For Listing Securities - Department Of The Treasury Bureau Of The Public Debt
Legal
Form Pd F 3500 E - Continuation Sheet For Listing Securities - Department Of The Treasury Bureau Of The Public Debt
Legal


Related Categories
Parent category: Legal