Cumulative Frequency (H) Page 3
ADVERTISEMENT
 Printable pdf") 1
1 2
2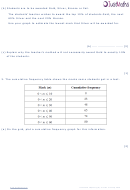 3
3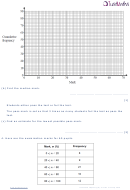 4
4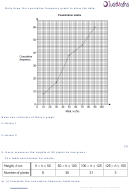 5
5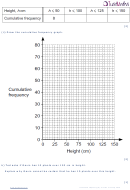 6
6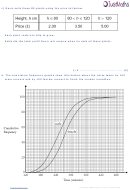 7
7 8
8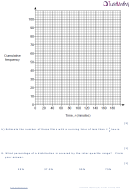 9
9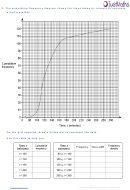 10
10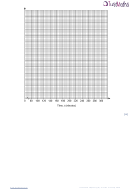 11
11 12
12(b) Students are to be awarded Gold, Silver, Bronze or Fail.
The students’ teacher wishes to award the top 10% of students Gold, the next
60% Silver and the next 20% Bronze.
Use your graph to estimate the lowest mark that Silver will be awarded for.
(b) ............................. [3]
(c) Explain why the teacher’s method will not necessarily award Gold to exactly 10%
of the students.
[1]
3. The cumulative frequency table shows the marks some students got in a test.
(a) On the grid, plot a cumulative frequency graph for this information.
[2]
Cumulative Frequency (H) - Version 2 January 2016
ADVERTISEMENT
0 votes
Related Articles
Related forms


 - Cumulative Frequency")
")


 Distribution Chart")


Related Categories
Parent category: Education