Task 4 - Extension Cumulative Frequency Page 3
ADVERTISEMENT
 1
1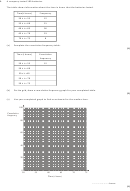 2
2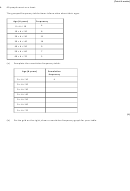 3
3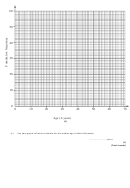 4
4(Total 4 marks)
4.
60 people went on a boat.
The grouped frequency table shows information about their ages.
Age (A years)
Frequency
4
0 < A ≤ 10
8
10 < A ≤ 20
11
20 < A ≤ 30
16
30 < A ≤ 40
9
40 < A ≤ 50
7
50 < A ≤ 60
5
60 < A ≤ 70
(a)
Complete the cumulative frequency table.
Age (A years)
Cumulative
frequency
4
0 < A ≤ 10
0 < A ≤ 20
0 < A ≤ 30
0 < A ≤ 40
0 < A ≤ 50
0 < A ≤ 60
0 < A ≤ 70
(1)
(b)
On the grid on the right, draw a cumulative frequency graph for your table.
ADVERTISEMENT
0 votes
Related Articles
Related forms

")
 - Cumulative Frequency")
")


Related Categories
Parent category: Education