Plotting Populations Worksheet - Graph Drawing Activity Page 3
ADVERTISEMENT
 1
1 2
2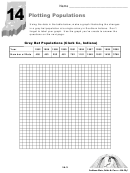 3
3 4
414
Name ________________________________
Plotting Populations
Using the data in the table below, make a graph illustrating the changes
in a gray bat population at a single colony in Southern Indiana. Don’t
forget to label your graph. Use the graph you’ve create to answer the
questions on the next page.
Grey Bat Populations (Clark Co, Indiana)
1982
1986
1988
1990
1991
1994
1997
1998
1999
2000
Year
400
453
253
481
752
1101
1949
1552
1430
3768
Number of Bats
14-3
Indiana Bats, Kids & Caves - Oh My!
ADVERTISEMENT
0 votes
Related Articles
Related forms


Related Categories
Parent category: Business