Ph102 Lab: Plancks Constant Worksheet Page 3
ADVERTISEMENT
 1
1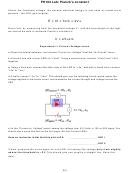 2
2 3
3PH102 Lab: Planckʼs constant
g) In excel, plot this data (I on the y axis and V on the x axis), and make a linear trend-
line through your data. The x-intercept of your trendline gives the threshold voltage
V
.
th
LED I
color = ____________
LED II
color = ___________
Slope = _______________ A/V
Slope = _______________ A/V
y intercept = __________________ A
y intercept = __________________ A
x intercept = __________________ V
x intercept = __________________ V
h) Repeat the steps above for your second LED (which should have a different color).
Experiment II: Estimating the wavelength
Estimate the wavelength of light emitted by your LED with the color charts provided. If
there is time, you can measure the wavelength directly using the diffraction gratings as
we did before.
LED I: __________ nm
LED II: __________ nm
Analysis
V
λ
= V
λ
= hc
From the equations above, we can derive:
th,1
1
th,1
1
Calculate both sides of this equation and record your answer below:
Now estimate Planckʼs constant for each LED, using c = 3.0 x 10
8
m/s and average the
λ
two results. Note that your wavelength
should be in meters, your voltage V
in volts, e
th
= 1.6x10
-19
J/V, and c=3x10
8
m/s. This gives h in units of J-sec.
h = eV
λ/c
th
h
= ________________
h
= ________________
h
= ________________
I
2
avg
What is the percentage error, compared to the accepted value of Planckʼs constant?
What is a possible source of error? (Hint: where is the energy going?
When you are finished:
Clean up and turn in a hard copy of your report
3/3
ADVERTISEMENT
0 votes
Related Articles
Related forms


, Statistical Data, Graphs, And Contour Analysis")
Related Categories
Parent category: Education