Reading A Line Graph Worksheet Template With Answer Key
ADVERTISEMENT
 1
1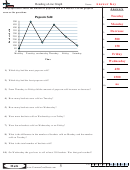 2
2Name:
Reading a Line Graph
The graph below shows the amount of popcorn sold at a theater. Use the graph to
A n s w e r s
answer the questions.
Tuesday
Popcorn Sold
Popcorn Sold
1.
500
500
Monday
450
450
2.
400
400
350
350
Decrease
3.
300
300
250
250
500
200
200
4.
150
150
100
100
150
5.
50
50
0
0
Monday
Monday
Tuesday Wednesday Thursday
Tuesday Wednesday Thursday
Friday
Friday
Saturday
Saturday
Friday
6.
Time
Time
Wednesday
7.
450
8.
1) Which day had the most popcorn sold?
1500
9.
2) Which day had the least popcorn sold?
no
10.
3) From Thursday to Friday did the amount of popcorn sold increase or decrease?
4) How many buckets were sold on Tuesday?
5) How many buckets were sold on Wednesday?
6) Were more buckets sold on Wednesday or on Friday?
7) Were fewer buckets sold on Wednesday or on Friday?
8) What is the difference in the number of buckets sold on Monday and the number
sold on Tuesday?
9) What is the total number of buckets sold?
10) On Wednesday the goal was to sell at least 350 buckets. Was that goal reached?
1-10 90 80 70 60 50 40 30 20 10 0
5
Math
ADVERTISEMENT
0 votes
Related Articles
Related forms


Related Categories
Parent category: Education