Reading A Line Graph Worksheet Template With Answer Key
ADVERTISEMENT
 1
1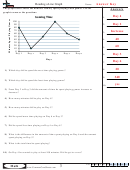 2
2Name:
Reading a Line Graph
The graph below shows the minutes Tommy spent playing video games. Use the
A n s w e r s
graph to answer the questions.
Day 4
Gaming Time
Gaming Time
1.
100
100
Day 2
90
90
2.
80
80
70
70
Increase
3.
60
60
50
50
40
40
40
4.
30
30
20
20
60
5.
10
10
0
0
Day 1
Day 1
Day 2
Day 2
Day 3
Day 3
Day 4
Day 4
Day 5
Day 5
Day 6
Day 6
Day 3
6.
Days
Days
Day 6
7.
20
8.
1) Which day did he spend the most time playing games?
340
9.
2) Which day did he spend the least time playing games?
yes
10.
3) From Day 2 to Day 3 did the amount of time he spent playing games increase or
decrease?
4) How many minutes did he play on Day 6?
5) How many minutes did he play on Day 5?
6) Did he spend more time playing on Day 6 or Day 3?
7) Did he spend less time playing on Day 4 or Day 6?
8) What is the difference in the amount of time spent playing on Day 6 and the amount
spent playing on Day 5?
9) What is the total time he spent playing?
10) On Day 4 he wanted to play at least 100 minutes. Did he get to or not?
1-10 90 80 70 60 50 40 30 20 10 0
3
Math
ADVERTISEMENT
0 votes
Related Articles
Related forms


Related Categories
Parent category: Education