Reading A Line Graph Worksheet Template With Answer Key
ADVERTISEMENT
 1
1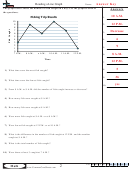 2
2Name:
Reading a Line Graph
The graph below shows the number of fish caught in a day. Use the graph to answer
A n s w e r s
the questions.
10 A.M.
Fishing Trip Results
Fishing Trip Results
1.
10
10
12 P.M.
9
9
2.
8
8
7
7
Decrease
3.
6
6
5
5
6
4
4
4.
3
3
2
2
9
5.
1
1
0
0
7 A.M.
7 A.M.
8 A.M.
8 A.M.
9 A.M.
9 A.M.
10 A.M.
10 A.M.
11 A.M.
11 A.M.
12 P.M.
12 P.M.
8 A.M.
6.
Time
Time
12 P.M.
7.
5
8.
1) What time were the most fish caught?
36
9.
2) What time were the fewest fish caught?
yes
10.
3) From 8 A.M. to 9 A.M. did the number of fish caught increase or decrease?
4) How many fish were caught at 9 A.M.?
5) How many fish were caught at 8 A.M.?
6) Were more fish caught at 9 A.M. or at 8 A.M.?
7) Were fewer fish caught at 12 P.M. or at 10 A.M.?
8) What is the difference in the number of fish caught at 12 P.M. and the number
caught at 9 A.M.?
9) What is the total number of fish caught?
10) Were there at least 3 caught at 7 A.M.?
1-10 90 80 70 60 50 40 30 20 10 0
2
Math
ADVERTISEMENT
0 votes
Related Articles
Related forms


Related Categories
Parent category: Education