Gcse (1-9) Velocity Time Graphs Worksheet Page 3
ADVERTISEMENT
 Velocity Time Graphs Worksheet Printable pdf") 1
1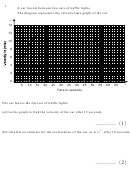 2
2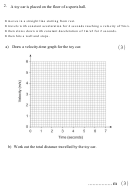 3
3 4
4 5
5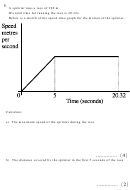 6
6 7
72.
A toy car is placed on the floor of a sports hall.
It moves in a straight line starting from rest.
It travels with constant acceleration for 4 seconds reaching a velocity of 5m/s.
It then slows down with constant deceleration of 1m/s2 for 2 seconds.
It then hits a wall and stops.
(3)
a) Draw a velocity-time graph for the toy car.
b) Work out the total distance travelled by the toy car.
................ m (3)
ADVERTISEMENT
0 votes
Related Articles
Related forms


Related Categories
Parent category: Education