9.1 Analyzing And Sketching Graphs Worksheet - Menlo Park City School District
ADVERTISEMENT
 1
1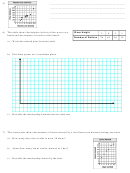 2
2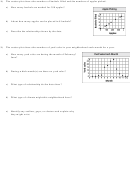 3
3Name: _________________________________________
Period: _____________
9.1
Analyzing and Sketching Graphs
Key Terms and Concepts!!
Describe the relationship you would expect between the data. Explain.
1) age of the automobile and the odometer reading
____________________________________________________________________________________
____________________________________________________________________________________
2) time spent fishing and the amount of bait in the bucket
____________________________________________________________________________________
____________________________________________________________________________________
3) number of passengers in a car and the number of traffic lights on the route
____________________________________________________________________________________
____________________________________________________________________________________
Describe the relationship between the data. Identify any outliers, gaps, or clusters.
4)
_____________________________________________________
_____________________________________________________
_____________________________________________________
_____________________________________________________
ADVERTISEMENT
0 votes
Related Articles
Related forms


Related Categories
Parent category: Education