Gcse (1-9) Velocity Time Graphs Worksheet Page 4
ADVERTISEMENT
 Velocity Time Graphs Worksheet Printable pdf") 1
1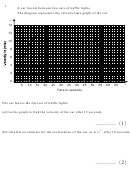 2
2 3
3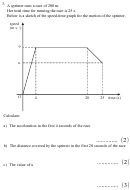 4
4 5
5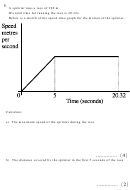 6
6 7
73.
A sprinter runs a race of 200 m.
Her total time for running the race is 25 s.
Below is a sketch of the speed-time graph for the motion of the sprinter.
speed
(m s )
–1
9
u
O
4
20
25 time (s)
Calculate:
a) The acceleration in the first 4 seconds of the race
.............. (2)
b) The distance covered by the sprinter in the first 20 seconds of the race
.............. (2)
c) The value of u
.............. (3)
ADVERTISEMENT
0 votes
Related Articles
Related forms


Related Categories
Parent category: Education