Colorado Income Tax Filing Guide - 2012 Page 20
ADVERTISEMENT
 1
1 2
2 3
3 4
4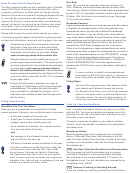 5
5 6
6 7
7 8
8 9
9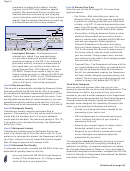 10
10 11
11 12
12 13
13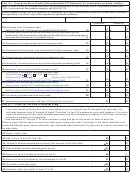 14
14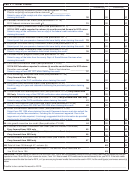 15
15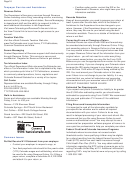 16
16 17
17 18
18 19
19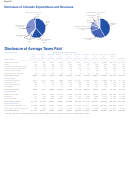 20
20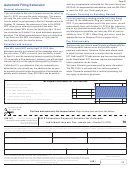 21
21 22
22 23
23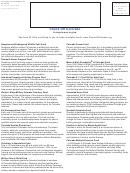 24
24Page 20
Disclosure of Colorado Expenditures and Revenues
Expenditures by Function
Revenues by Source
Other
Other
Transportation
2.8%
8.0%
4.4%
Justice
Taxes
6.9%
39.2%
Education
42.2%
Federal Grants &
Business, Community
Contracts
& Consumer Affairs
34.2%
10.8%
Interest & Rents
1.7%
Licenses Permits
Social Assistance
Charges for Goods &
& Fines
27.8%
Services
3.4%
18.7%
Disclosure of Average Taxes Paid
Fiscal Year 2010
Adjusted Family Money Income
Less
$10,000
$15,000
$20,000
$30,000
$40,000
$50,000
$70,000
$80,000
$100,000
than
to
to
to
to
to
to
to
to
and
$10,000
$15,000
$20,000
$30,000
$40,000
$50,000
$70,000
$80,000
$100,000
over
Average
State Taxes:
________________________________________________________________________________________________________________
Individual Income
$40
$89
$182
$369
$671
$971
$1,412
$1,917
$2,469
$6,418
$1,830
Sales
155
191
194
251
324
343
444
536
608
1120
471
Gasoline and Special Fuels
53
69
86
110
128
148
171
186
201
302
159
Licenses and Registrations
53
58
80
87
114
140
153
173
198
255
141
Alcoholic Beverages
3
3
2
4
6
6
9
13
12
31
10
Cigarettes and Tobacco
46
60
69
85
79
74
86
90
76
91
78
Total State Taxes
$350
$470
$613
$906
$1,322
$1,681
$2,275
$2,915
$3,563
$8,216
$2,691
Local Taxes:
Residential Property
$341
$391
$694
$856
$937
$1,027
$1,609
$1,687
$1,824
$3,161
$1,418
Sales and Use
244
301
304
394
509
538
697
841
955
1,758
740
Specific Ownership
42
71
86
100
118
134
158
170
192
287
149
Occupation
2
5
7
10
15
20
27
34
42
66
26
Total Local Taxes
$630
$767
$1,092
$1,361
$1,580
$1,719
$2,491
$2,732
$3,014
$5,272
$2,334
Federal Taxes:
Individual Income
$392
$508
$708
$1,169
$2,022
$2,959
$4,574
$6,313
$8,184
$32,228
$7,932
Medicare **
137
276
388
589
876
1,153
1,536
1,966
2,419
4,396
1,603
Social Security **
481
969
1,365
2,072
3,081
4,053
5,402
6,912
8,506
13,274
5,258
Total Federal Taxes
$1,010
$1,752
$2,461
$3,831
$5,980
$8,165
$11,512
$15,191
$19,109
$49,898
$14,793
Total Taxes Paid
Households & Employers **
$1,990
$2,989
$4,166
$6,097
$8,882
$11,565
$16,277
$20,838
$25,686
$63,386
$19,817
Less Taxes Paid by Employer
309
622
877
1,331
1,979
2,603
3,469
4,439
5,463
8,835
3,430
Households Only
$1,681
$2,367
$3,289
$4,766
$6,903
$8,962
$12,808
$16,399
$20,224
$54,551
$16,387
** Employers and households both pay taxes to Medicare and Social Security on employees’ behalf.
ADVERTISEMENT
0 votes
Related Articles
Related forms


 Form 104bep - Colorado Nonresident Beneficiary Estimated Income Tax Payment Voucher - 2012
Financial
Form 104bep - Colorado Nonresident Beneficiary Estimated Income Tax Payment Voucher - 2012
Financial
 Form 104bep - Colorado Nonresident Beneficiary Estimated Income Tax Payment Voucher - 2012
Financial
Form 104bep - Colorado Nonresident Beneficiary Estimated Income Tax Payment Voucher - 2012
Financial


Related Categories
Parent category: Financial