Polar Coordinates And Complex Numbers Worksheets With Answers - Math 611b Page 30
ADVERTISEMENT
 1
1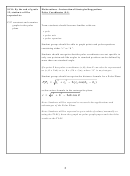 2
2 3
3 4
4 5
5 6
6 7
7 8
8 9
9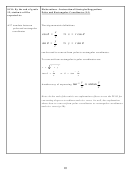 10
10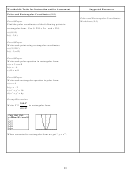 11
11 12
12 13
13 14
14 15
15 16
16 17
17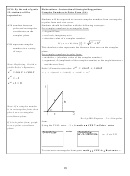 18
18 19
19 20
20 21
21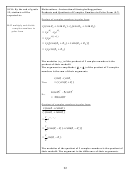 22
22 23
23 24
24 25
25 26
26 27
27 28
28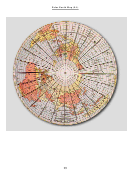 29
29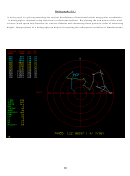 30
30 31
31 32
32 33
33 34
34 35
35 36
36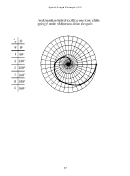 37
37 38
38 39
39 40
40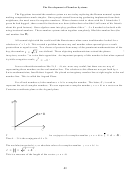 41
41 42
42 43
43 44
44 45
45 46
46 47
47 48
48 49
49 50
50Hodographs (9.1)
A hodograph is a plot representing the vertical distribution of horizontal winds using polar coordinates.
A hodograph is obtained using data from a radiosonde balloon. By plotting the end points of the wind
vectors (wind speed and direction) at various altitudes and connecting these points in order of increasing
height. Interpretation of a hodograph can help in forecasting the subsequent evolution of thunderstorms.
30
ADVERTISEMENT
0 votes
Related Articles
Related forms


Related Categories
Parent category: Education