Hmh Texas Test Prep Questions Math Worksheet - 7th Grade, 2015 Page 23
ADVERTISEMENT
 1
1 2
2 3
3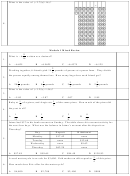 4
4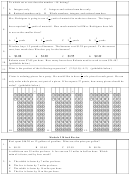 5
5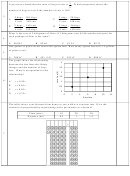 6
6 7
7 8
8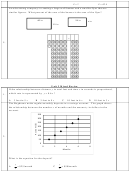 9
9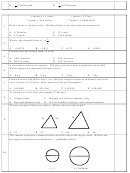 10
10 11
11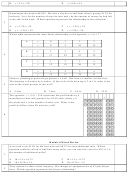 12
12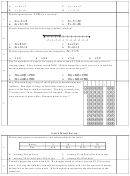 13
13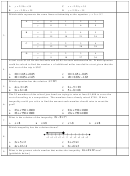 14
14 15
15 16
16 17
17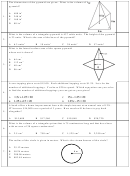 18
18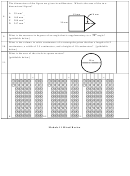 19
19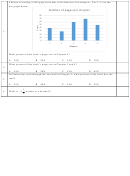 20
20 21
21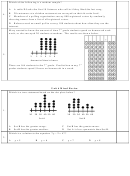 22
22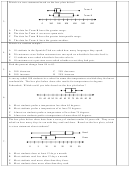 23
23 24
24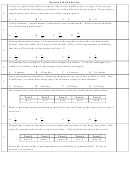 25
25 26
26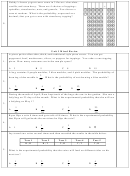 27
27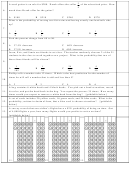 28
28 29
29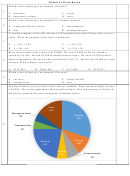 30
30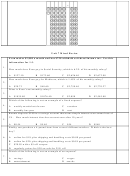 31
31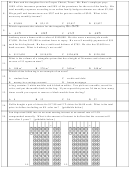 32
32Which is a true statement based on the box plots below?
Team A
Team B
3.
0
100
200
300
400
500
600
A The data for Team B have the greater range.
B The data for Team A are more symmetric.
C The data for Team B have the greater interquartile range.
D The data for Team A have the greater median.
Which is a random sample?
A 10 students in the Spanish Club are asked how many languages they speak.
4.
B 20 customers at an Italian restaurant are surveyed on what their favorite food is.
C 15 students were asked what their favorite color is.
D 10 customers at a pet store were asked whether or not they had pets.
Find the percent change from 84 to 63.
5.
A 30% decrease
C 25% decrease
B 30% increase
D 25% increase
A survey asked 100 students in a school to name the temperature at which they feel most
comfortable. The box plot below shows the results for temperatures in degrees
Fahrenheit. Which could you infer based on the box plot below?
6.
35 40 45 50 55 60 65 70 75 80 85 90 95
A Most students prefer a temperature less than 65 degrees.
B Most students prefer a temperature of at least 70 degrees.
C Almost no students prefer a temperature of less than 75 degrees.
D Almost no students prefer a temperature of more than 65 degrees.
The box plots below show data from a survey of students under 14 years old. They were
asked on how many days in a month they read and draw. Based on the box plots, which
is a true statement about students?
Read
Draw
7.
0
5
10
15
20
25
30
A Most students draw at least 12 days a month.
B Most students read less than 12 days a month.
C Most students read more often than they draw.
D Most students draw more often than they read.
ADVERTISEMENT
0 votes
Related Articles
Related forms


Related Categories
Parent category: Education