Assessment For The California Mathematics Standards Booklet - Grade 7 Page 17
ADVERTISEMENT
 1
1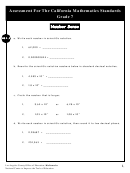 2
2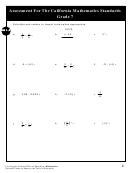 3
3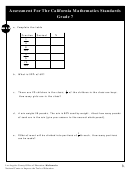 4
4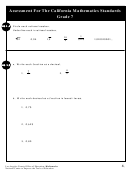 5
5 6
6 7
7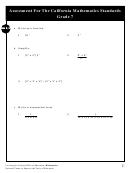 8
8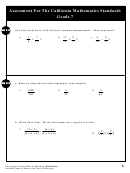 9
9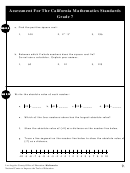 10
10 11
11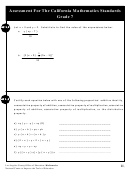 12
12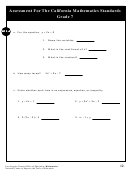 13
13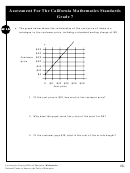 14
14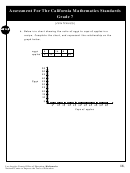 15
15 16
16 17
17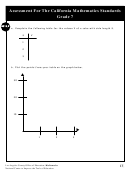 18
18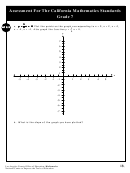 19
19 20
20 21
21 22
22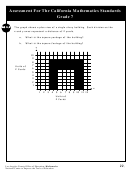 23
23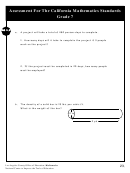 24
24 25
25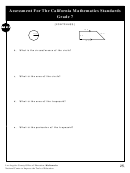 26
26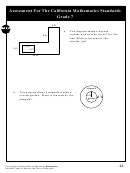 27
27 28
28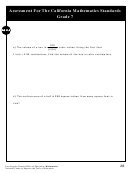 29
29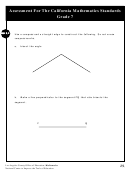 30
30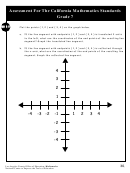 31
31 32
32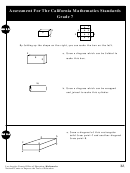 33
33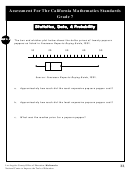 34
34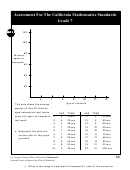 35
35 36
36 37
37Assessment For The California Mathematics Standards
Grade 7
2 2 2 2 2
a. y = 3
y = 3
y = 3x x x x x
y = 3
Plot the graph for the following values: x = 0, x = 1, x = 2, x = -1,
y = 3
AF 3.1
AF 3.1
AF 3.1
AF 3.1
AF 3.1
x = -2, x = -3
y
30
25
20
15
10
5
x
-3
-2
-1
1
2
3
-5
-10
y = 2x
y = 2x
3 3 3 3 3
b. y = 2x
y = 2x
y = 2x
Plot the graph for the following values: x = 0, x = 1, x = 2, x = -1, x = -2
y
15
10
5
x
1
2
3
-3
-2
-1
-5
-10
-15
16.
Los Angeles County Office of Education: Mathematics
National Center to Improve the Tools of Education
ADVERTISEMENT
0 votes
Related Articles
Related forms

 Form Rpd-41295 - Application For New Mexico Retail Food Store Certification For The Food Deduction Pursuant To Section 7-9-92 Nmsa 1978 - 2005
Financial
Form Rpd-41295 - Application For New Mexico Retail Food Store Certification For The Food Deduction Pursuant To Section 7-9-92 Nmsa 1978 - 2005
Financial
 Form Rpd-41295 - Application For New Mexico Retail Food Store Certification For The Food Deduction Pursuant To Section 7-9-92 Nmsa 1978
Financial
Form Rpd-41295 - Application For New Mexico Retail Food Store Certification For The Food Deduction Pursuant To Section 7-9-92 Nmsa 1978
Financial
 Form Rpd-41295 - Application For New Mexico Retail Food Store Certification For The Food Deduction Pursuant To Section 7-9-92 Nmsa 1978
Financial
Form Rpd-41295 - Application For New Mexico Retail Food Store Certification For The Food Deduction Pursuant To Section 7-9-92 Nmsa 1978
Financial


Related Categories
Parent category: Education