Periodic Trends Worksheet Page 15
ADVERTISEMENT
 1
1 2
2 3
3 4
4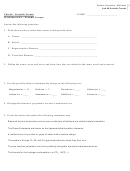 5
5 6
6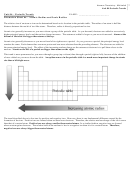 7
7 8
8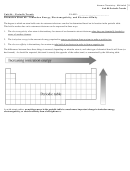 9
9 10
10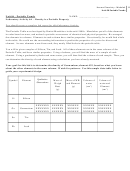 11
11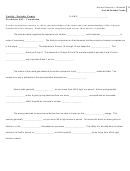 12
12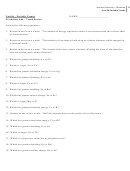 13
13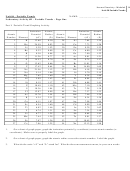 14
14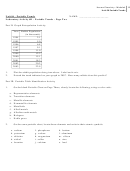 15
15 16
16 17
17 18
18Honors Chemistry - Michalek
15
Unit 06 Periodic Trends
Unit 06 – Periodic Trends
NAME: ______________________
Laboratory Activity 6B – Periodic Trends – Page Two
Part II: Graph Extrapolation Activity
Year Rabbit Population
(in thousands)
1994
2.1
1995
5.0
1996
6.8
1997
9.1
1998
11.0
1999
12.3
2000
15.1
2001
18.3
2002
20.2
2003
22.9
1.
Plot the rabbit population data given above. Label each axis.
2.
Extend the trend indicated on your graph to 2007. How many rabbits does this predict?
Part III: Periodic Table Identification Activity
1.
On the blank Periodic Chart on Page Three, clearly locate the following, using a color code:
a. Representative elements
b. Transition elements
c. Metallic elements
d. Nonmetallic elements
e. Metalloids
f. Alkali metals
g. Alkaline-earth metals
h. Halogens
i. Noble gases
2.
On the same periodic chart, locate these elements and write in their atomic symbols:
a. sodium
f. phosphorus
k. barium
b. potassium
g. carbon
l. aluminum
c. chlorine
h. magnesium
m. silicon
d. nickel
i. sulfur
n. zinc
e. bromine
j. calcium
o. lead
ADVERTISEMENT
0 votes
Related Articles
Related forms


Related Categories
Parent category: Education