Kinetics Worksheet With Answers Page 2
ADVERTISEMENT
 1
1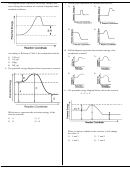 2
2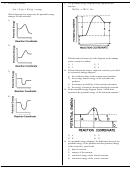 3
3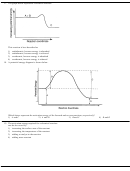 4
4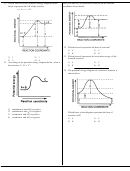 5
5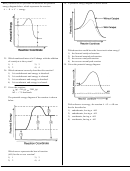 6
6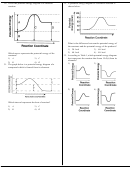 7
7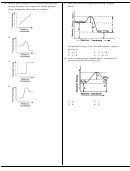 8
8 9
9 10
107. The diagram below represents the energy changes that
9. Which graph represents an endothermic reaction?
occur during the formation of a certain compound under
1)
3)
standard conditions.
2)
4)
10. Which diagram represents the potential energy of an
exothermic reaction?
According to Reference Table I, the compound could be
1)
3)
1) C
H
(g)
2
6
2) CO
(g)
2
3) HI(g)
4) NH
(g)
3
8. The potential energy diagram below represents a reaction.
2)
4)
11. The potential energy diagram below shows the reaction
X + Y → Z.
Which arrow represents the activation energy of the
forward reaction?
1) A
3) C
2) B
4) D
When a catalyst is added to the reaction, it will change
the value of
1) 1 and 2
3) 2 and 3
2) 1 and 3
4) 3 and 4
ADVERTISEMENT
0 votes
Related Articles
Related forms


Related Categories
Parent category: Education