Parallel And Perpendicular Lines Worksheet Page 20
ADVERTISEMENT
 1
1 2
2 3
3 4
4 5
5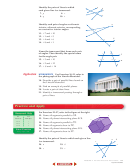 6
6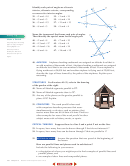 7
7 8
8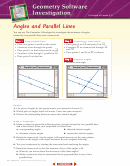 9
9 10
10 11
11 12
12 13
13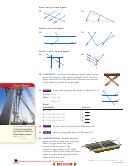 14
14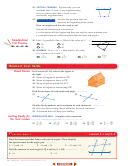 15
15 16
16 17
17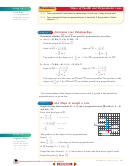 18
18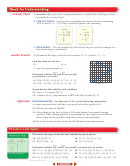 19
19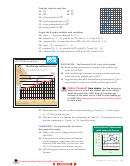 20
20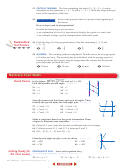 21
21 22
22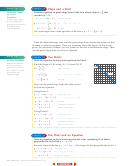 23
23 24
24 25
25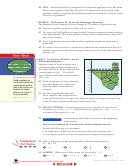 26
26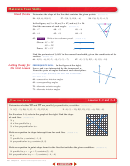 27
27 28
28 29
29 30
30 31
31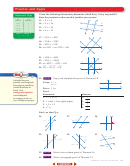 32
32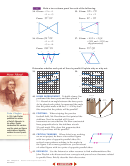 33
33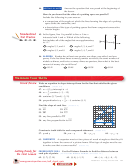 34
34 35
35 36
36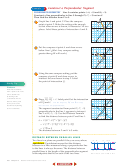 37
37 38
38 39
39 40
40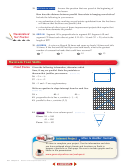 41
41 42
42 43
43 44
44 45
45 46
46 47
47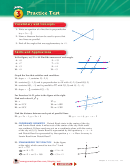 48
48 49
49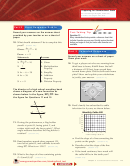 50
50Find the slope of each line.
y
L
25. AB
26. PQ
Q
27. LM
28. EF
A
29. a line parallel to LM
30. a line perpendicular to PQ
x
M
O
B
31. a line perpendicular to EF
32. a line parallel to AB
E
F
P
Graph the line that satisfies each condition.
4, passes through P( 2, 1)
33. slope
34. contains A( 1,
3), parallel to CD with C( 1, 7) and D(5, 1)
35. contains M(4, 1), perpendicular to GH with G(0, 3) and H( 3, 0)
2
36. slope
, contains J( 7,
1)
5
37. contains Q( 2,
4), parallel to KL with K(2, 7) and L(2,
12)
38. contains W(6, 4), perpendicular to DE with D(0, 2) and E(5, 0).
USA TODAY Snapshots
®
POPULATION
For Exercises 39–41, refer to the graph.
Median age continues to rise
39. Estimate the annual rate of change of the median age
The median age in the USA has more
from 1970 to 2000.
than doubled since 1820.
35.3
40. If the median age continues to increase at the same rate,
40
what will be the median age in 2010?
35
1
41. Suppose that after 2000, the median age increases by
of a
30
3
year anually. In what year will the median age be 40.6?
16.7
25
20
Online Research
Data Update Use the Internet or
15
other resource to find the median age in the United
States for years after 2000. Does the median age
10
increase at the same rate as it did in years leading up
5
to 2000? Visit
0
to learn more.
1820
1850
1900
1950
2000
Source: Census Bureau
By Sam Ward, USA TODAY
42. Determine the value of x so that a line containing (6, 2) and (x,
1) has a slope
3
of
. Then graph the line.
7
43. Find the value of x so that the line containing (4, 8) and (2,
1) is perpendicular to
the line containing (x, 2) and ( 4, 5). Graph the lines.
COMPUTERS
For Exercises 44–46, refer to
Instructional Classrooms
the graph at the right.
with Internet Access
44. What is the rate of change between 1998
100
y
and 2000?
64%
80
45. If the percent of classrooms with Internet
60
access increases at the same rate as it did
77%
40
between 1999 and 2000, in what year will
51%
20
90% of classrooms have Internet access?
0
46. Will the graph continue to rise indefinitely?
x
1998
1999
2000
Explain.
Year
Source: U.S. Census Bureau
Lesson 3-3 Slopes of Lines 143
ADVERTISEMENT
0 votes
Related Articles
Related forms


Related Categories
Parent category: Education