Handling Data Worksheet With Answers - S A Lomax - 2006 Page 6
ADVERTISEMENT
 1
1 2
2 3
3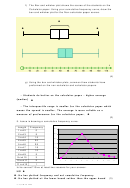 4
4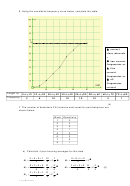 5
5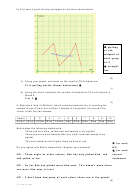 6
6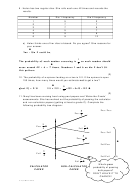 7
7 8
8b) Plot your 4 point moving averages on the time series below:
plotting
at the
midpoint of
each group
of 4
straight
line
(2)
c) Using your graph, comment on the trend of Phil’s behaviour
It is getting better (fewer detentions)
(1)
d) Using the trend, estimate the number of detentions Phil will receive in
Week 9.
2 or 3
(1)
8. Bob has a tube of ‘Millions’ (small coloured sweets). He is counting the
sweets to see if there are millions if sweets in his packet. He records the
colour of the first ten sweets:
Sweet
1
2
3
4
5
6
7
8
9
10
Colour Blue Yellow Blue Yellow Red
Blue Blue Blue
Red Blue
Bob makes the following statements:
-
There are only blue, yellow and red sweets in my packet
There are more blue sweets than any other coloured sweet in my
-
packet
The next sweet out will highly likely be blue or red
-
for each
NO
Do you agree with Bob’s statements? Explain your answers.
for each
NO – There might be other colours. Bob has only picked blue, red
correct
and yellow so far.
statement
NO – So far Bob has picked more blue ones. This doesn’t mean there
are more blue ones in total
NO – I don’t know how many of each colour there are in the packet
(6)
S A LOMAX 2006
ADVERTISEMENT
0 votes
Related Articles
Related forms


Related Categories
Parent category: Education