Seventh Grade Staar With The New Teks Worksheet - 2015 Page 34
ADVERTISEMENT
 1
1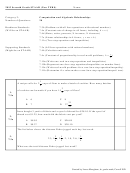 2
2 3
3 4
4 5
5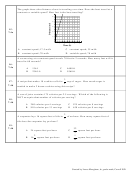 6
6 7
7 8
8 9
9 10
10 11
11 12
12 13
13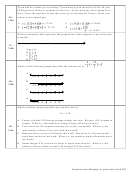 14
14 15
15 16
16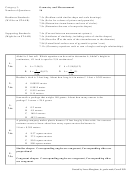 17
17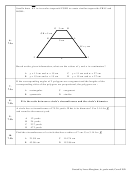 18
18 19
19 20
20 21
21 22
22 23
23 24
24 25
25 26
26 27
27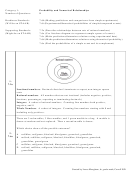 28
28 29
29 30
30 31
31 32
32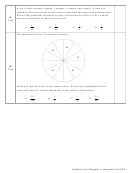 33
33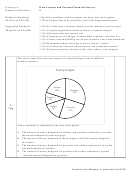 34
34 35
35 36
36 37
37 38
38 39
39 40
40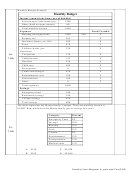 41
41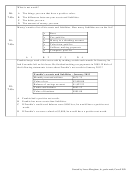 42
42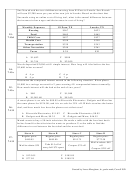 43
43 44
44 45
45Category 4:
Data Analysis and Personal Financial Literacy
Number of Questions:
9
Readiness Standards:
7.6g (Solve problems with bar graphs, dot plots, and circle graphs)
(Will be on STAAR)
7.12a (Compare data in dot plots/box plots with shape/center/spread)
Supporting Standards:
7.12b (Use data from a random sample to make inferences about a pop.)
(Might be on STAAR)
7.12c (Compare populations based on data in a random sample)
7.13a (Calculate sales and income tax)
7.13b (Components of a budget, fixed/variable expenses, calculate %s)
7.13c (Create asset and liability record and construct a net worth statement)
7.13d (Determine budget and wage to meet a family’s needs)
7.13e (Calculate and compare simple interest and compound interest)
7.13f (Compare monetary incentives like sales, rebates, and coupons)
The circle graph shows the percentages of a family budget used for different
monthly expenses.
Family Budget
Utilities
20%
Mortgage
30%
Gasoline
10%
1.
Clothes
Groceries
7.6g
15%
25%
Which statement is supported by the data in the graph?
A The amount of money budgeted for utilities and gasoline combined is less than
the amount budgeted for the mortgage.
B The amount of money budgeted of the mortgage is half the amount budgeted
for clothes.
C The amount of money budgeted for groceries and clothes combined is twice the
amount budgeted for utilities.
D The amount of money budgeted for gasoline and clothes combined is greater
than the amount budgeted for groceries.
th
Created by Lance Mangham, 6
grade math, Carroll ISD
ADVERTISEMENT
0 votes
Related Articles
Related forms


")

Related Categories
Parent category: Education