Seventh Grade Staar With The New Teks Worksheet - 2015 Page 36
ADVERTISEMENT
 1
1 2
2 3
3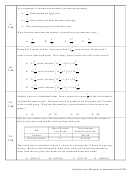 4
4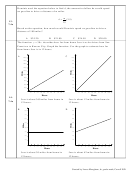 5
5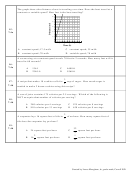 6
6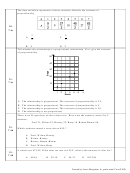 7
7 8
8 9
9 10
10 11
11 12
12 13
13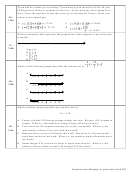 14
14 15
15 16
16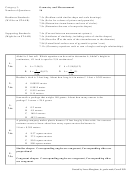 17
17 18
18 19
19 20
20 21
21 22
22 23
23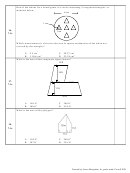 24
24 25
25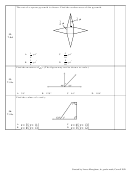 26
26 27
27 28
28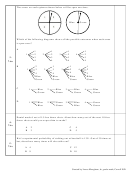 29
29 30
30 31
31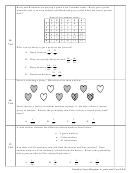 32
32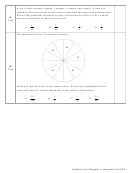 33
33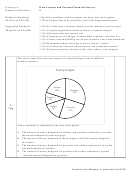 34
34 35
35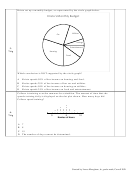 36
36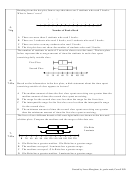 37
37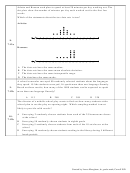 38
38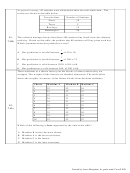 39
39 40
40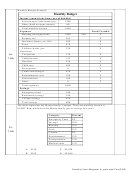 41
41 42
42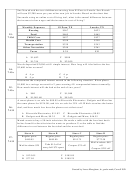 43
43 44
44 45
45Krista set up a monthly budget, as represented by the circle graph below.
Krista's Monthly Budget
Utilities
Car
Savings
Entertainment
3.
7.6g
Housing
Food
Which conclusion is NOT supported by the circle graph?
A Krista spends 50% of her income on housing and food.
B Krsita spends 25% of her income of her car and utilities.
C Krista spends 50% of her income on housing an utilities.
D Krista spends 25% of her income on food and entertainment.
Colleen is training over the summer for a triathlon. The amount of time that she
spends training daily is displayed on the dot plot shown. How many days did
Colleen spend training?
4.
7.6g
0
5
10
Number of Hours
A 7
B 8
C 15
D The number of days cannot be determined.
th
Created by Lance Mangham, 6
grade math, Carroll ISD
ADVERTISEMENT
0 votes
Related Articles
Related forms


")

Related Categories
Parent category: Education