Intervals, Graphs And Charts, Measurements Worksheet With Answers Page 17
ADVERTISEMENT
 1
1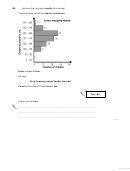 2
2 3
3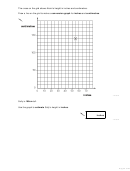 4
4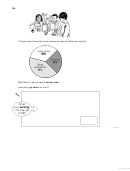 5
5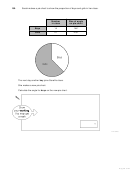 6
6 7
7 8
8 9
9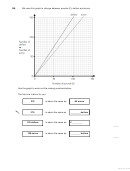 10
10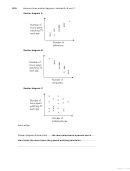 11
11 12
12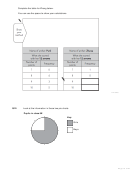 13
13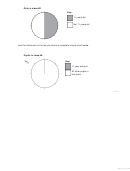 14
14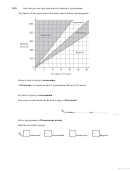 15
15 16
16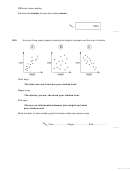 17
17 18
18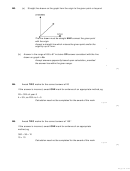 19
19 20
20 21
21 22
22 23
23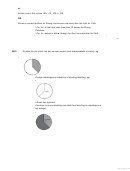 24
24 25
25 26
26 27
27120 boys chose reading.
Estimate the number of boys who chose cinema.
1 mark
Q15.
Here are three scatter graphs showing the heights of people and the cost of clothes.
Chen says,
‘The taller you are, the more your clothes cost.’
Megan says,
‘The shorter you are, the more your clothes cost.’
Alfie says,
‘There is no relationship between your height and what
your clothes cost.’
Write the letter of each scatter graph that shows what each person says.
Chen...................... Megan ...................... Alfie ......................
1 mark
Page 17 of 27
ADVERTISEMENT
0 votes
Related Articles
Related forms


Related Categories
Parent category: Education